Join Our Telegram channel to stay up to date on breaking news coverage
The Biconomy price prediction shows that BICO is likely to climb above the 21-day moving average to begin the upward trend as the price mounted up by 2.58%.
Biconomy Prediction Statistics Data:
- Biconomy price now – $0.42
- Biconomy market cap – $81.8 million
- Biconomy circulating supply – 190.9 million
- Biconomy total supply – 1 billion
- Biconomy Coinmarketcap ranking – #260
BICO/USD Market
Key Levels:
Resistance levels: $55, $60, $65
Support levels: $35, $30, $25
Your capital is at risk
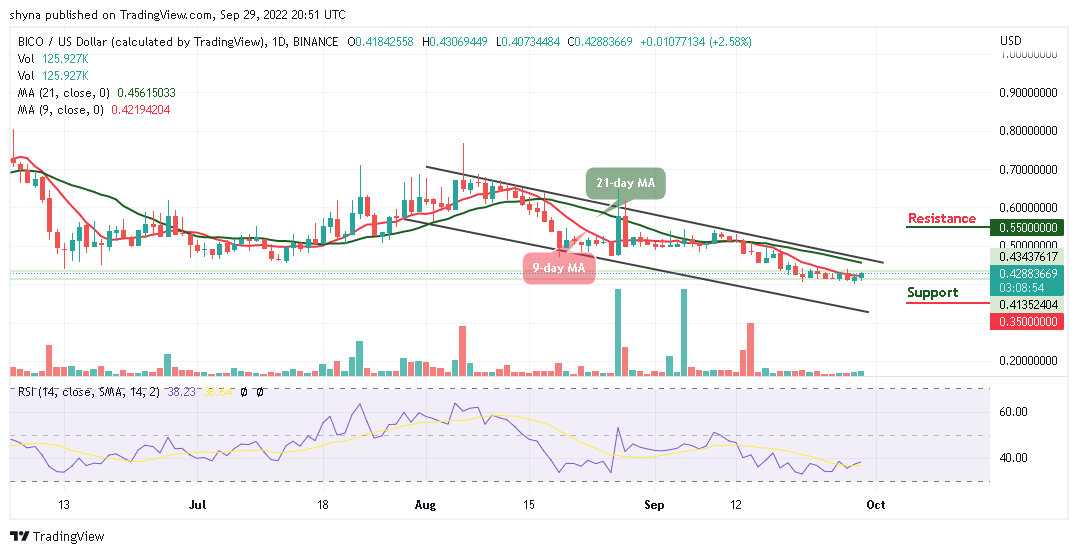
BICO/USD is hovering at around $0.42 as the coin prepares for the upside. Today’s trading begins with a slight bullish movement in the market as the coin moves to cross above the 9-day moving average. However, traders are anticipating that the current price movement is an indication of the upcoming price rally in the market.
Biconomy Price Prediction: BICO Gets Ready for the Upside
According to the daily chart, the next step for the Biconomy price is to cross above the 21-day moving average. Once this is done, bulls may now push the coin towards the upper boundary of the channel to hit the resistance levels at $55, $60, and $65 respectively.
However, as the technical Indicator Relative Strength Index (14) moves toward the 40-level, BICO/USD may confirm the bullish movement, once this plays out; it can manage to sustain the bullish movement towards the upper boundary of the channel. Meanwhile, if the price decides to make a quick turn to the south, the support levels could be found at $35, $30, and $25 respectively.
Against Bitcoin, the Biconomy moves to cross above the 9-day moving average as the coin heads to the upside. At the moment, bulls are pushing the coin to the positive side while the technical Indicator Relative Strength Index (14) moves to cross above the 40-level.
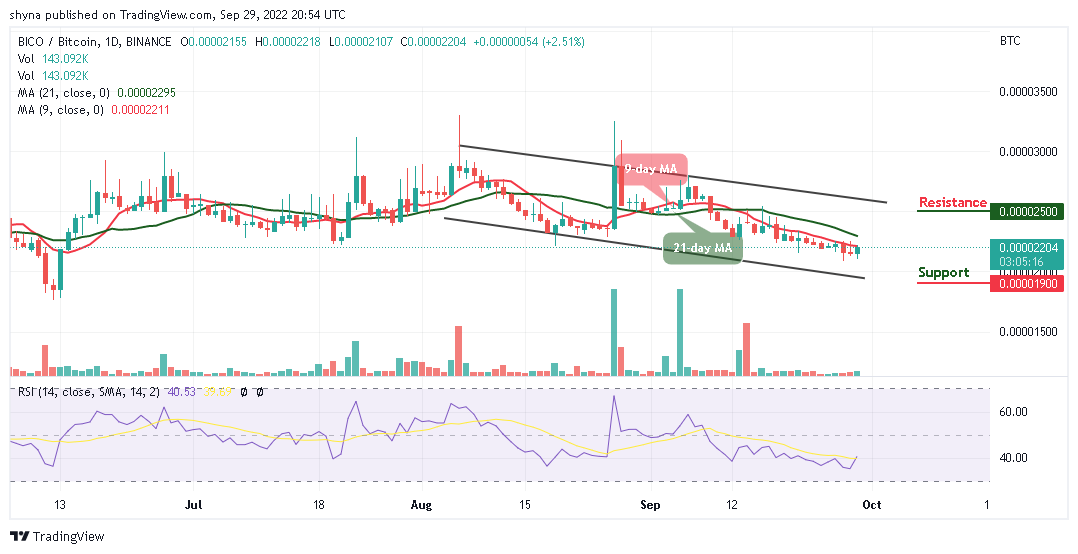
However, if the bears drag the price below the moving averages, BICO/BTC may fall to the support level of 1900 SAT and below. Meanwhile, the continuation of the bullish movement may push the coin above the 21=day moving average, and any further bullish movement may cause the coin to hit the resistance level of 2500 SAT and above.
Join Our Telegram channel to stay up to date on breaking news coverage