Join Our Telegram channel to stay up to date on breaking news coverage
BCH Price Prediction – January 21
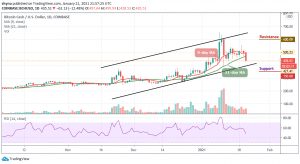
Today, the price of Bitcoin Cash slides below $450 after rejection at the $499 level.
BCH/USD Market
Key Levels:
Resistance levels: $600, $620, $640
Support levels: $350, $330, $310
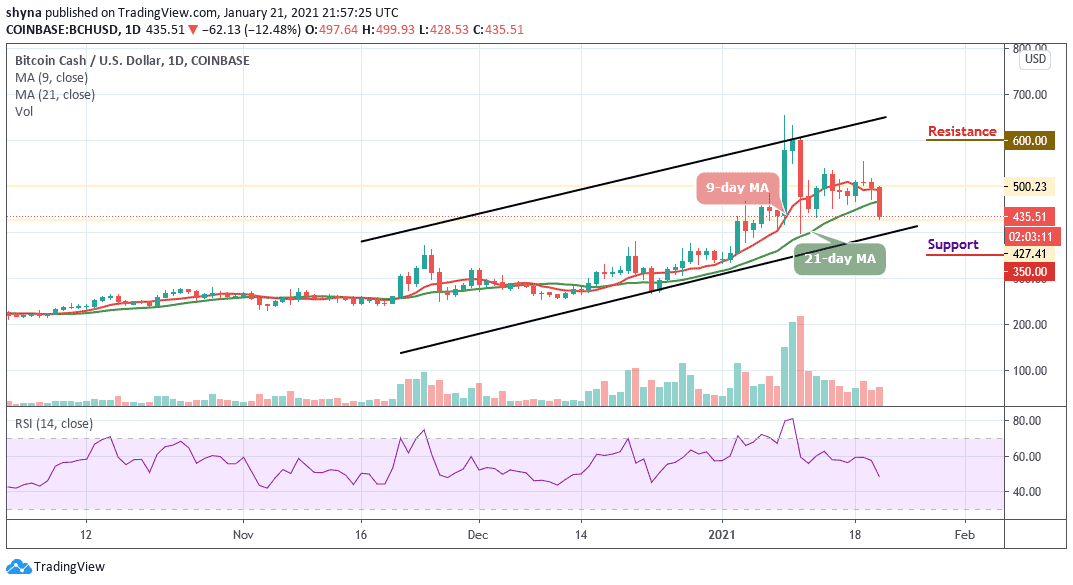
BCH/USD price is seen rolling down as reveals by the daily chart. Meanwhile, the current downfall was expected as the altcoins were hitting huge counters, and the market had to come under selling pressure. However, should Bitcoin Cash remain below the 9-day and 21-day moving averages, the bears might come back to dominate the market.
What to Expect from BCH
On the upside, a sustained move above the channel may ease the initial selling pressure and create momentum for the bulls with the focus to move the market to the next resistance levels of $600, $620, and $640 respectively. At the moment, the technical indicator RSI (14) moves below 50-level, which indicates that the downward momentum may likely continue to play out.
Moreover, if the 9-day moving average stays above the 21-day moving average, the coin may either follow an uptrend or remain within the consolidation area. In addition, it is good to note that the recent consolidation within the channel is necessary for the bullish action. On the other hand, the support levels could be at $350, $330, and $310.
When compares with Bitcoin, one thing to note here is that the market is preparing to change the trend and a short-term bearish breakout is most likely to play out because the technical indicator RSI (14) signal line is moving below the 55-level and when turning downward, the price could break below the moving averages to find the nearest support level at 1200 SAT.
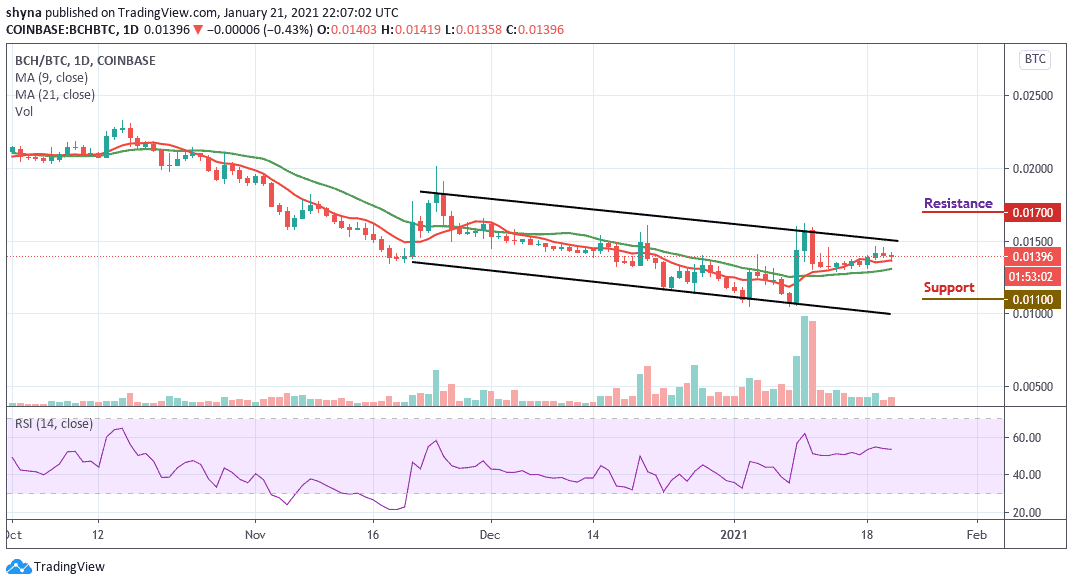
Therefore, if the buyers could gather and succeed in breaking the upper boundary of the channel, the market price may likely touch the next resistance level of 1700 SAT and above. In other words, a retest could lower the price to 1100 SAT and 1000 SAT support levels.
Join Our Telegram channel to stay up to date on breaking news coverage