Join Our Telegram channel to stay up to date on breaking news coverage
Bitcoin (BTC) Price Prediction – January 21
BTC/USD is trading below the moving averages and the coin is likely to remain beneath with a few downward moves.
BTC/USD Long-term Trend: Bullish (Daily Chart)
Key levels:
Resistance Levels: $38,500, $40,500, $42,500
Support Levels: $27,500, $25,500, $23,500

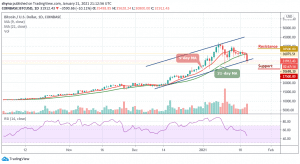
It is safe to say that BTC/USD has been turbulent in recent days, after tight trading for a few days with relatively low volatility. A few days ago, the Bitcoin price rose sharply by moving above the resistance levels of $40,500 and $41,500 against the US dollar. The coin even exceeded $41,800 levels before correcting lower. At the moment, the price is declining as it is currently trading below the 9-day and 21-day moving averages at $31,912.
Would Bitcoin Go Up or Remain as the Downside?
Looking at the daily chart, a crucial uptrend could probably form above the moving averages, with support close to $30,500 on the daily chart. However, if the decline occurs below the lower boundary of the channel, the market price could extend its downward correction to the $29,500 level and any other loss could possibly push the price of Bitcoin to the support level of $29,000.
At the time of writing, the Bitcoin price had dropped slightly to $30,800. A further drop may cause the market to reach the critical supports at $27,500, $25,500, and $23,500. In other words, if the market were to rebound, we could see the next buying pressure towards the resistance levels of $38,500, $40,500, and $42,500. Meanwhile, BTC now maintains a bearish trend on the daily chart, with the RSI (14) moving below 50-level.
BTC/USD Medium-Term Trend: Bearish (4H Chart)
Looking at the 4-hour chart, Bitcoin’s price is currently trading around $32,092 and below the 9-day and 21-day moving averages after falling from $35,628 where the coin touched today. From a technical point of view, the trend is in the hands of the sellers.
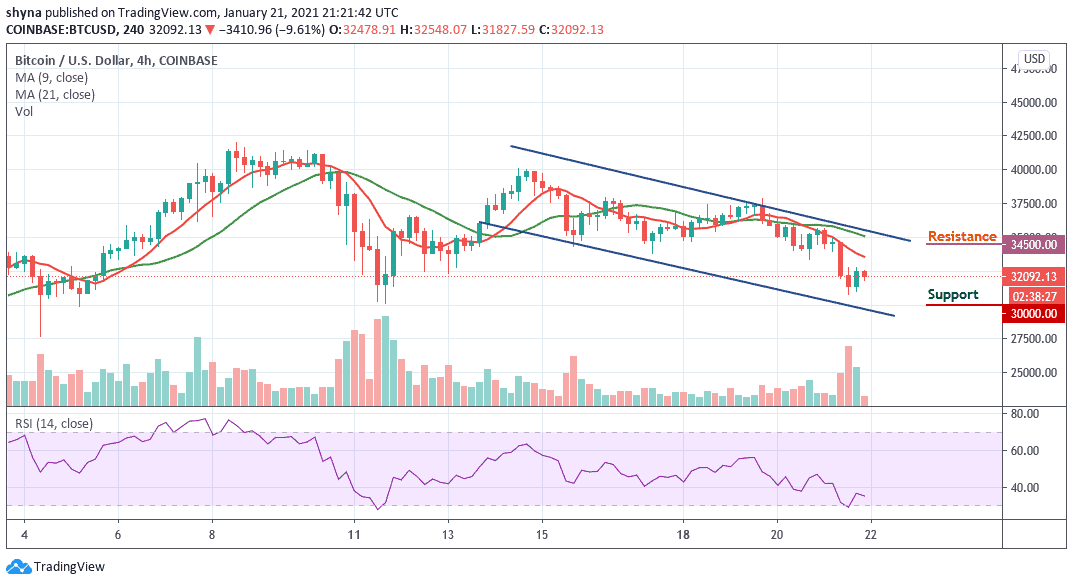
The technical indicator RSI (14) is retreating even though it had not reached the lower boundary of the channel. Meanwhile, as long as the downward trend continues, keeping Bitcoin above $40,000 maybe a little bit tedious. In this case, it is best we look at possible support levels, starting at $30,000 and below. While the resistance lies at $34,500 and above.
Join Our Telegram channel to stay up to date on breaking news coverage