Join Our Telegram channel to stay up to date on breaking news coverage
API3 Price Prediction – August 15
Having had a deep technical thought of how the API3 market transverses, I noticed that the crypto economy has continued to strive for higher points from a lower baseline to a high resistance line. The financial book of records has it that the crypto economy witnessed an all-time high of $10.31 on April 7, 2021, and its all-time low value occurred on June 13, 2022 (two months ago)) at $1.04. Price is now trading at $2.51 at an average percentage rate of 5.29 positive.
API3 Price Statistics:
API3 price now – $2.51
API3 market cap – $142.3 million
API3 circulating supply – 56.6 million
API3 total supply – 113.9 million
Coinmarketcap ranking – #168
API3/USD Market
Key Levels:
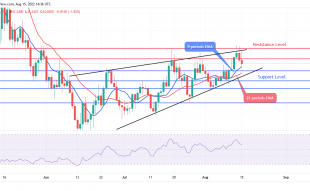
Resistance levels: $8, $12, $16
Support levels: $1.50, $1, $0.50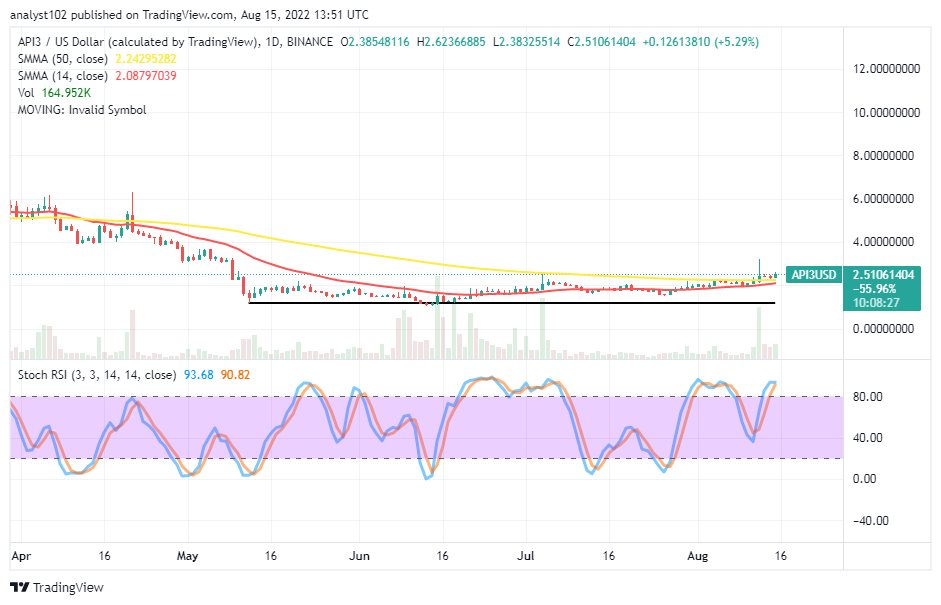 API3/USD – Daily Chart
The daily chart showcases that the API3 market has continued to strive for higher points against the trade worth of the US fiat currency over time. The 50-day SMA indicator is at $2.2430, slightly above the $2.0880 value line of the 14-day SMA indicator. The lower basely horizontal line drew at $1.20 closely around the all-time low of the market below the SMA trend lines. The Stochastic Oscillators are in the overbought region, maintaining ranges of 90.82 and 93.68. They now attempt to close their lines within.
Your capital is at risk.
Can there be more upward surges in the API3/USD market beyond its current trading value?
Traders need to exercise some degree of caution at this moment as the API3/USD market has continued to strive for higher points up to the psychological area around an area termed as the upper range spot where the 50-day SMA is positioned. Going by the reading of the Stochastic Oscillators in the overbought region, the situation portends that long-position placers need to be wary of fake pull up that can emanate at any point in time, as it can turn out into a downward reversal-moving session abruptly.
On the downside of the technical, the API3/USD market bears may now have to brace up to spot a rejection that can actively resurface around the resistance-trading points not too far away from above the trend lines of the SMAs. The emergence of a bearish candlestick can be that a downward-trending force is piling up toward getting some downs afterward.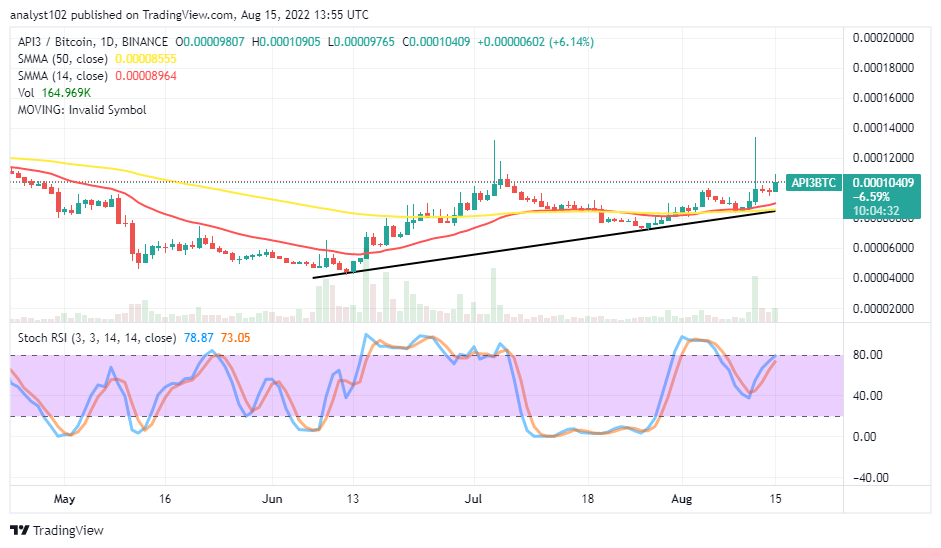
API3/BTC Price Analysis
API3, from the price analysis chart in comparison, has been keeping a bullish outlook against the trending force of Bitcoin over a couple of sessions. The cryptocurrency pair price has continued to strive for higher points. The 14-day SMA indicator has conjoined with the 50-day SMA indicator in an attempt to bend northward. The Stochastic Oscillators are positioned around 73.05 and 78.87 range points, closely pointing northbound below the range of 80. It shows that base crypto may still control the trend for some time against its counter-trading crypto instrument.
Read more:
Join Our Telegram channel to stay up to date on breaking news coverage