Join Our Telegram channel to stay up to date on breaking news coverage
The sellers are dominating Solana market
Solana Price Analysis – August 15
Solana will reach $52 and $58 provided the resistance level of $45 does not hold. In case the $45 holds, the price may decrease to the support level at $40 and $34 if the $42 level permits.
SOL/USD Market
Key Levels:
Resistance levels: $45, $47, $52
Support levels: $42, $40, $34
SOL/USD Long-term Trend: Bullish
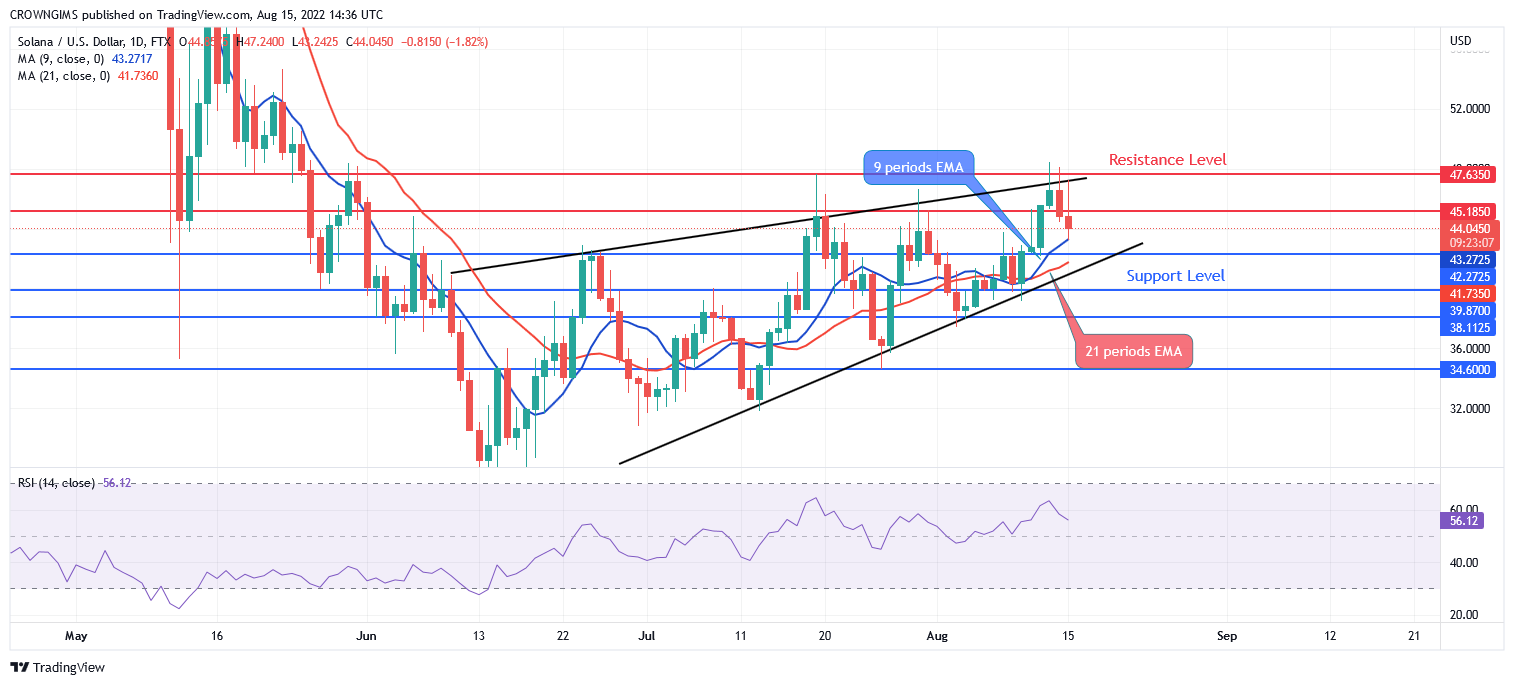
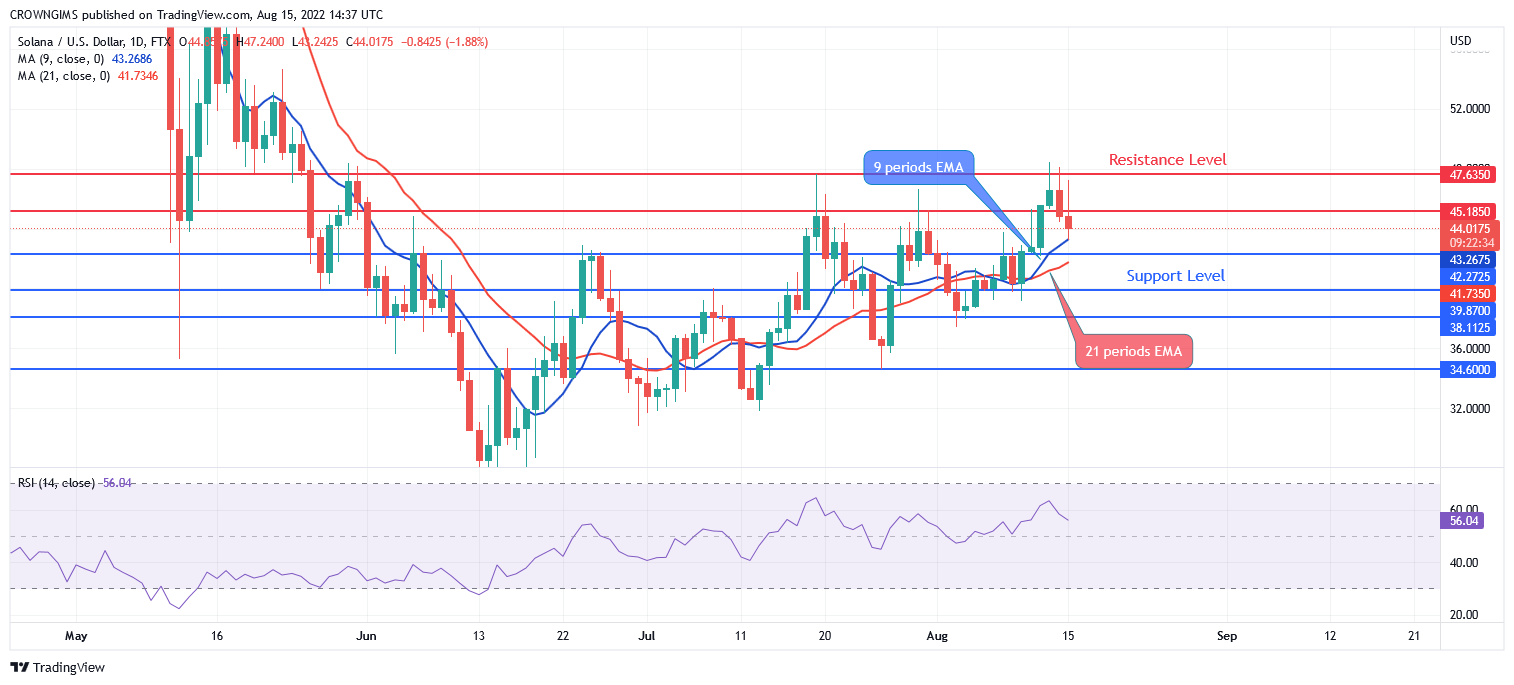
SOLANA started a bullish movement on 19 June after several days of bearish movement; this is clearly noticed on the daily chart when the price decline from the high of $59 and bottomed at $28 support level. More bullish candles continue to emerge and the price inclining towards the $40 price level. The cryptocurrency has reached the resistance level of $47. The coin is pulling back today with the formation of a daily bearish candle.
The daily chart has shown that buyers are dominating the market. The price has cross over the 9 periods EMA and 21 periods EMA upside and the former EMA has crossed the later confirming the beginning of a bullish trend. The price will reach $52 and $58 provided the resistance level of $45 does not hold. In case the $45 holds, the price may decrease to the support level at $40 and $34 if the $42 level permits. Meanwhile, the relative strength index period 14 is at 55 levels displaying a bearish signal which may be a pullback.
Your capital is at risk
SOL/USD Medium-term Trend: Bullish
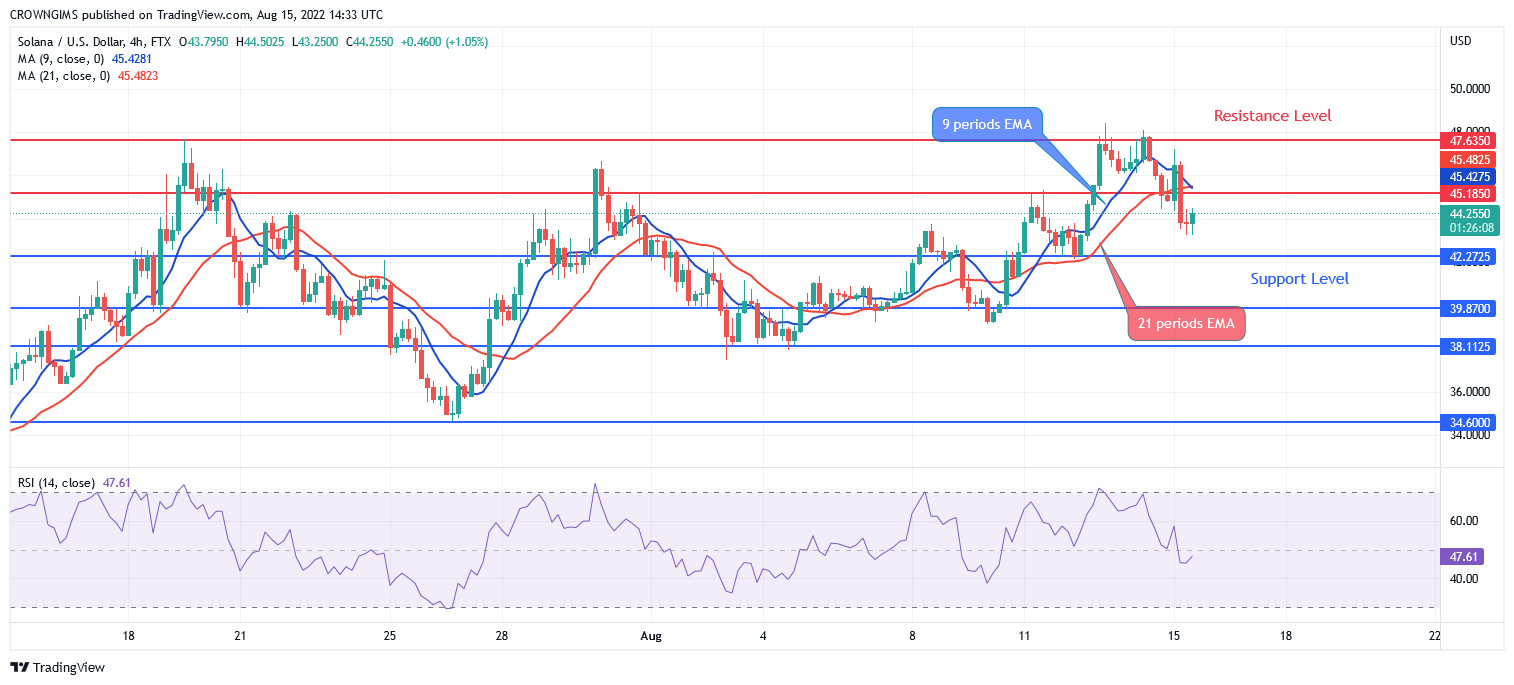
Solana’s performance has been bullish in the medium-term outlook, this may be due to a persistence pressure from the buyers of SOLANA. In other words, the price actions are in an upward trend after it breaks out at the dynamic resistance level. The market may move higher and this may continue unless there is a strong opposition from the bears or the resistance level at $45 holds.
The positive spike could test the important resistance level of $47. Further push by the Bulls may bring the coin to the high resistance level of $52. The RSI (14) is at the 46 levels and the signal line pointing down to indicate the sell signal which may be a pullback.
Related
Join Our Telegram channel to stay up to date on breaking news coverage


