Join Our Telegram channel to stay up to date on breaking news coverage
The Ankr price prediction adds a tremendous 4.62% gain and at the time of writing, it is trading around the $0.026 resistance level.
Ankr Price Statistics Data:
- Ankr price now – $0.026
- Ankr market cap – $270.6 million
- Ankr circulating supply – 10 billion
- Ankr total supply – 10 billion
- Ankr Coinmarketcap ranking – #116
ANKR/USD Market
Key Levels:
Resistance levels: $0.033, $0.035, $0.037
Support levels: $0.020, $0.018, $0.016
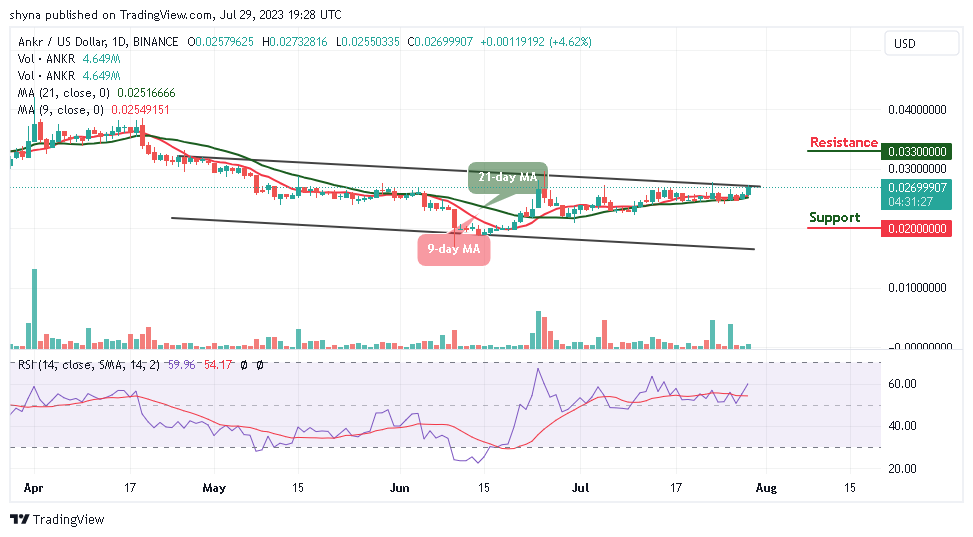
ANKR/USD is fetching a decent hike in the last 24 hours, which takes the coin above the resistance level of $0.026 level. The coin is already keeping two straight days of bullish movements. Meanwhile, ANKR/USD is one of the most emerging coins in the market at the moment, and it is likely to touch $0.030 in the coming days as its next resistance. The long-term outlook may continue to be bullish.
Ankr Price Prediction: Would Ankr Go Up or Down?
As the daily chart reveals, the Ankr price is trading above the 9-day and 21-day moving averages within the channel. On the upside, if the price breaks above the upper boundary of the channel and closes above it, ANKR/USD may likely continue its uptrend and could reach the resistance levels of $0.033, $0.035, and $0.037.
On the contrary, if the technical indicator failed to break above the positive side, there is a tendency of bears to return to the market and this may likely cause the market price to hit the nearest support levels at $0.020, $0.018, and $0.016 respectively. Technically, the Relative Strength Index (14) is likely to cross above the 60-level, suggesting additional bullish signals.
Against Bitcoin, Ankr has been following a bullish movement as the coin moves to cross above the upper boundary of the channel. However, the recent rise could allow the cryptocurrency to keep the bullish movement, which is a promising sign for buyers.
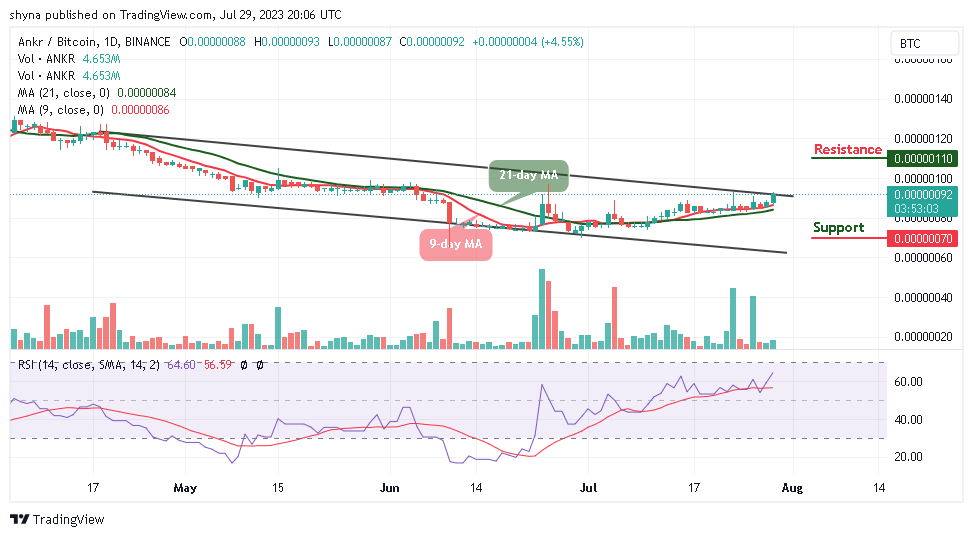
Moreover, if the bulls can break above the channel, higher resistance could be located at 110 SAT and above. Meanwhile, from the downside, the nearest level of support now lies below the moving averages. Beneath this, further support could be found at 70 SAT and below. The Relative Strength Index (14) is moving above the 60-level which is a good sign for the bulls as the momentum is on their side.
Ankr Alternatives
According to the daily chart, the Ankr price has been increasing. within the channel and the ongoing trend could move a little bit higher so as to reach the nearest resistance level above the upper boundary of the channel. However, if the buyers put in more effort, ANKR/USD may create additional gains.
Moreover, the Wall Street Memes token happens to be one of the most successful tokens of the year. Meanwhile, by leveraging a massive community behind it, the $WSM token is speeding through a highly successful presale at the moment as almost $19 million has been raised so far.
New OKX Listing - Wall Street Memes

- Established Community of Stocks & Crypto Traders
- Featured on Cointelegraph, CoinMarketCap, Yahoo Finance
- Rated Best Crypto to Buy Now In Meme Coin Sector
- Team Behind OpenSea NFT Collection - Wall St Bulls
- Tweets Replied to by Elon Musk
Join Our Telegram channel to stay up to date on breaking news coverage