
Join Our Telegram channel to stay up to date on breaking news coverage
The Ankr price prediction reveals that ANKR is rising with a gain of 10.29% over the past 24 hours as it rises above the $0.035 level.
Ankr Price Statistics Data:
- Ankr price now – $0.038
- Ankr market cap – $365.7 million
- Ankr circulating supply – 9.6 billion
- Ankr total supply – 10 billion
- Ankr Coinmarketcap ranking – #103
ANKR/USD Market
Key Levels:
Resistance levels: $0.055, $0.060, $0.065
Support levels: $0.022, $0.017, $0.012
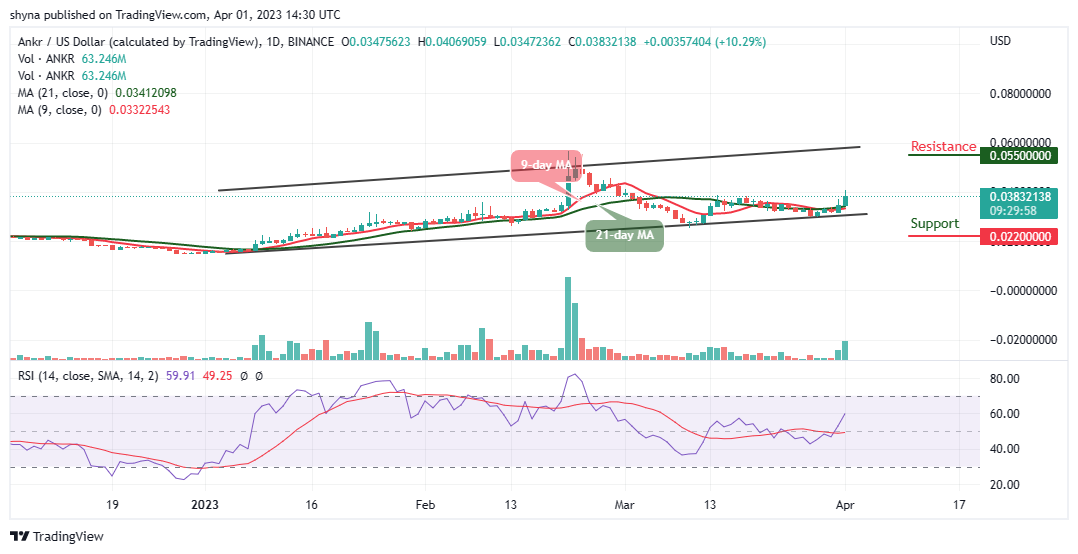
ANKR/USD is currently holding strong above $0.035 as this level has been supporting the market since a few days ago. Moreover, it could be possible that the more the resistance level of $0.0.034 is tested, the more it is likely to break higher. On the other hand, if the Ankr price slides below the 9-day and 21-day moving averages, traders could expect the market price to break beneath and this may likely hit the critical support levels of $0.022, $0.017, and $0.012.
Ankr Price Prediction: Can Ankr Price Retrace Back to the Upside?
According to the daily chart, the Ankr price is hovering around $0.038 with a slight bullish movement towards the upper boundary of the channel. However, if the bulls put more pressure, the resistance levels of $0.055, $0.060, and $0.065 could be reached. Moreover, the technical indicator Relative Strength Index (14) is moving to cross above the 60-level.
Against Bitcoin, the Ankr price is seen demonstrating high positive signs across the market. The daily price movement is perpetually looking bullish in the long term and it is likely for the coin to trade near the upper boundary of the channel within the channel. However, ANKR/BTC is currently changing hands at 133 SAT after recovering from below the 21-day moving average.
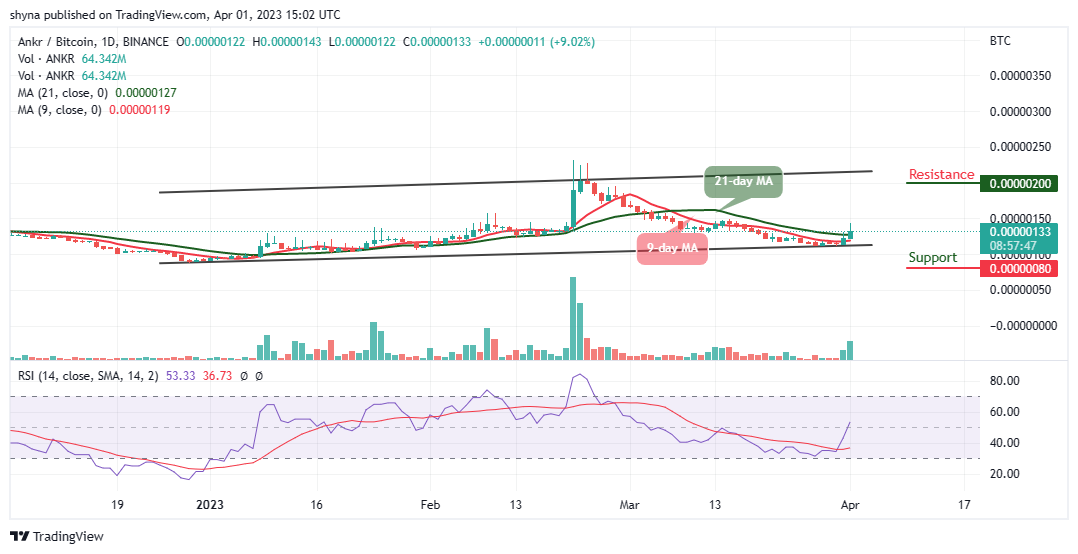
On the upside, if the bulls can push the coin toward the upper boundary of the channel, traders can expect initial resistance at 150 SAT. Above this, higher resistance is could be located at 200 SAT and above. Alternatively, if the sellers bring the market below the lower boundary of the channel, ANKR/BTC may hit critical support at 80 SAT and below. Meanwhile, the Relative Strength Index (14) is crossing above the 50-level, suggesting bullish movement.
Alternatives to Ankr
At the time of writing, the Ankr price is hovering at $0.038 as the coin remains above the 9-day and 21-day moving averages. The recovery seems to have started as the technical indicator Relative Strength Index (14) moves to cross above the 60-level. Similarly, the Love Hate Inu token distinguishes itself from other meme coins due to its versatile accurate survey and poll results powered by the Ethereum blockchain, the token has already raised up to $2.5 million in the ongoing presale.
Join Our Telegram channel to stay up to date on breaking news coverage