
Join Our Telegram channel to stay up to date on breaking news coverage
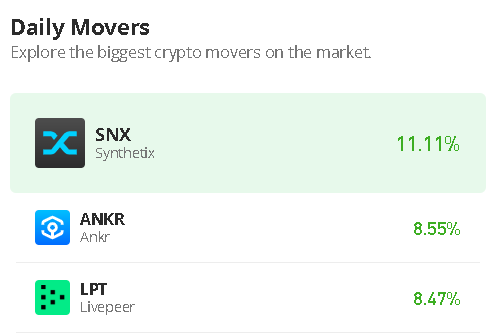
The Ankr price prediction reveals that ANKR begins to form higher as the bears push the coin above the channel.
Ankr Price Statistics Data:
- Ankr price now – $0.029
- Ankr market cap – $283.2 million
- Ankr circulating supply – 9.6 billion
- Ankr total supply – 10 billion
- Ankr Coinmarketcap ranking – #131
ANKR/USD Market
Key Levels:
Resistance levels: $0.035, $0.037, $0.039
Support levels: $0.022, $0.020, $0.018
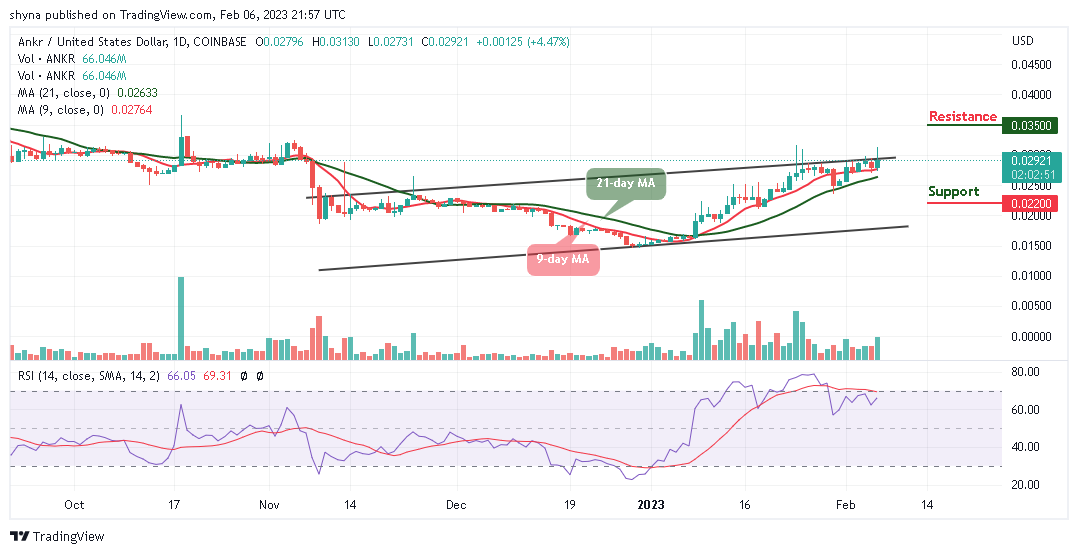
ANKR/USD is likely to cross above the upper boundary of the channel as the coin touches the resistance level of $0.031. However, since a few days ago, ANKR/USD has been trading above the 9-day and 21-day moving averages and this refrains the coin from going back to the support level of $0.025.
Ankr Price Prediction: Will Ankr Continue to Move Higher?
The Ankr price is ready to create move additional bullish movement as the coin continues to rise and could probably cross above the upper boundary of the channel if the bulls hit the $0.032 resistance level. Therefore, any further bullish movement above this barrier may push the price to the potential resistance levels of $0.035, $0.037, and $0.039.
Nevertheless, this technical Prediction may be invalidated if the bears break below the 9-day and 21-day moving averages as any further bearish movement may reach the support levels of $0.022, $0.020, and $0.018. Moreover, the technical indicator Relative Strength Index (14) is hovering above the 60-level to give to keep the coin on the upside.
Against Bitcoin, the Ankr price is exchanging hands above the 9-day and 21-day moving averages with a major resistance level of 136 SAT. The long-term moving averages may likely keep the bullish movement as the market is starting a new trend by crossing above the upper boundary of the channel.
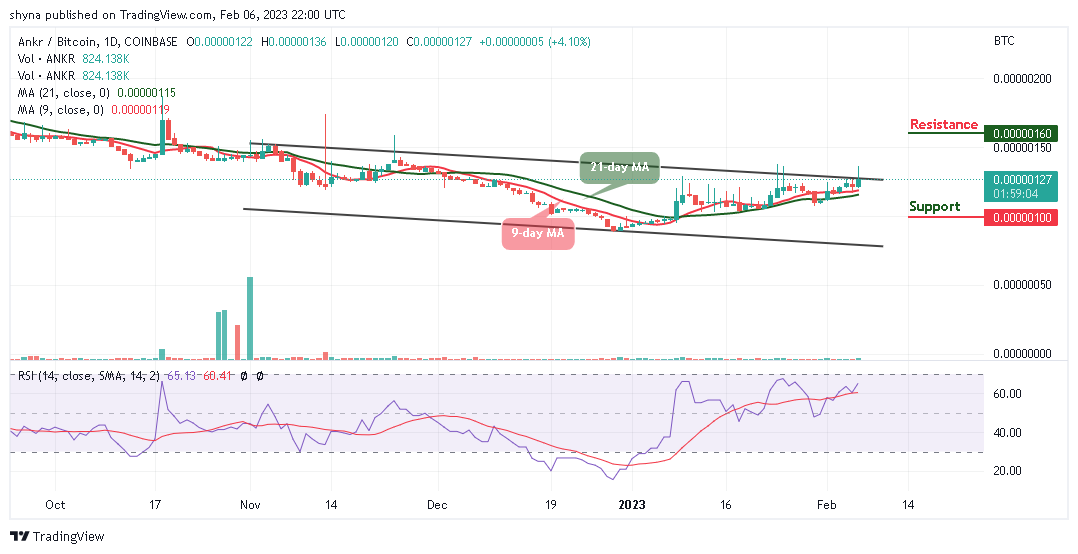
However, if the buyers could push the price above this barrier, a higher resistance level could be located at 160 SAT and above while the technical indicator Relative Strength Index (14) remains above the 60-level, suggesting more bullish signals. Moreover, should the bulls fail to move the current market value to the north, the bears may step back into the market, and the nearest support level could be located at 100 SAT and below.
Ankr Alternatives
According to the daily chart, the Ankr price begins a steady increase at the beginning of today’s trading. If the bulls increase the pressure, the pair could be rising and might climb further above the $0.35 resistance level. Similarly, the MEMAG token is still very hot as the coin reaches new heights with $3 million raised in presale. The supply has grown rapidly in recent days, indicating not only how well the play-to-win platform has managed to generate market interest, but also how well it should do when it launches later in the year.
Join Our Telegram channel to stay up to date on breaking news coverage