Join Our Telegram channel to stay up to date on breaking news coverage
The Ankr price prediction shows that bulls are dominating the market as the price moves from $0.025 to $0.029.
ANKR Prediction Statistics Data:
- ANKR price now – $0.028
- ANKR market cap – $259.6 million
- ANKR circulating supply – 9.66 billion
- ANKR total supply – 10 billion
- ANKR Coinmarketcap ranking – #121
ANKR/USD Market
Key Levels:
Resistance levels: $0.035, $0.037, $0.039
Support levels: $0.020, $0.018, $0.016
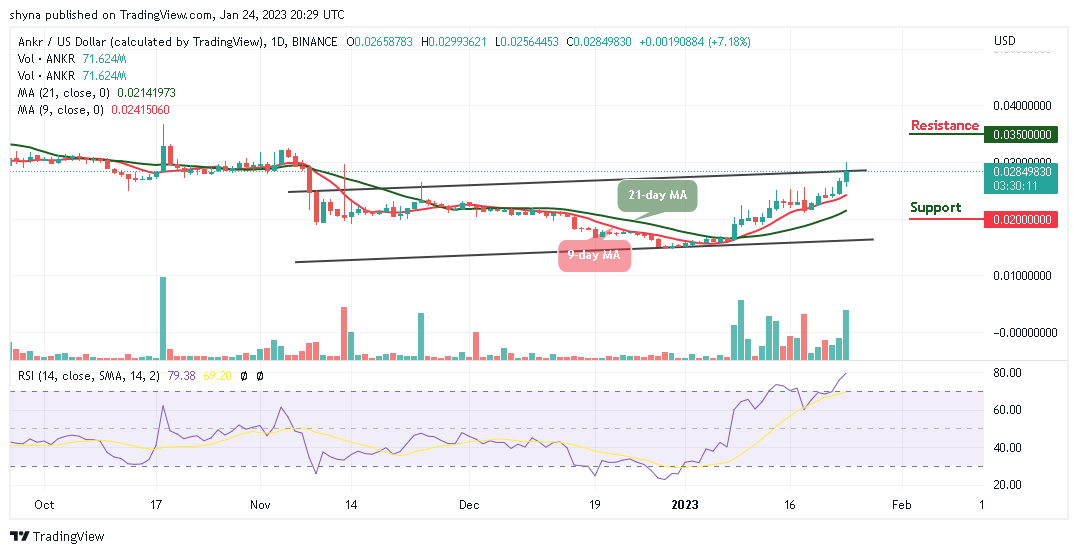
ANKR/USD is still positive but it looks like it lacks enough momentum to hit the resistance level of 0.035. Following the recent price, Ankr faces a potential resistance at the $0.030 level above the upper boundary of the channel. A break above this is could produce a huge green candle to the upside, reaching resistances at $0.035, $0.037, and $0.039 levels and above. By then, the ANKR market would have been in a bullish run.
Ankr Price Prediction: ANKR/USD Faces the North
According to the daily chart, the Ankr price is hovering well above the 9-day and 21-day moving averages but a bearish step into the market could drag the price toward the south which may likely roll the market back to $0.025 support. However, if the bulls fail to hold this support, a possible breakdown to $0.020, $0.018 and $0.016 supports may be visited, and this may establish another low for the market.
Looking at the daily chart, traders can see that the trading volume is rising, giving a sign of an upcoming big move. Moreover, the technical indicator, Relative Strength Index (14) signal line is moving within the overbought region due to the price increase which could reveal more buy signals for the market.
When compares with Bitcoin, the daily chart reveals that bulls are showing serious commitment to Ankr trading. However, following the recent positive signs, the trend may continue to go up if the buyers continue to increase the buying pressure in the market.
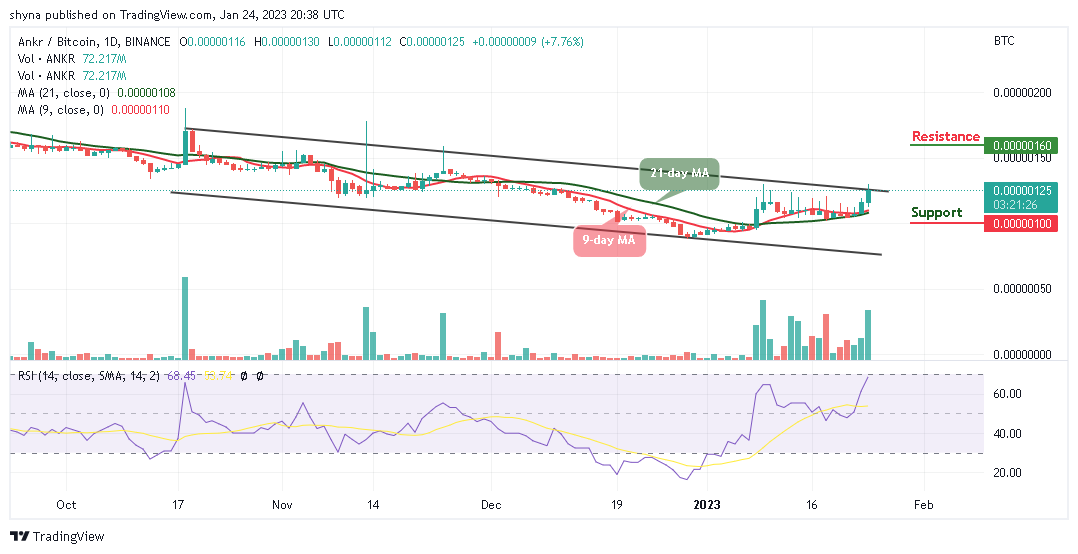
Nonetheless, the Relative Strength Index (14) signal line is seen moving to cross into the overbought region. Therefore, if the Ankr price can move above the upper boundary of the channel, the market price could follow an upward movement, pushing further can touch the resistance level of 160 SAT but a bearish slide below the 9-day and 21-day moving averages could lower the price to the support level of 100 SAT and below.
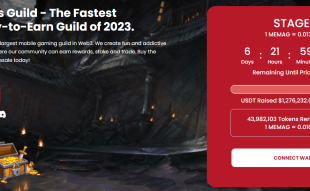
Nonetheless, Meta Masters Guild (MEMAG) is the most rapidly growing Play-to-Earn guild of this year. Therefore, it is going to be the biggest mobile gaming guild in Web3. Fun and interesting games, which are compatible with NFTs, are created. And there, community members are rewarded as they speculate and also invest. The MEMAG presale is ongoing and close to $1.5 million has been raised so far.
Related
- BTC Billionaire Chamath Palihapitiya Aims To Run For California Governor
- Meta Masters Guild – The Fastest Growing Play-to-Earn Guild of 2023
- How to buy MEMAG
Join Our Telegram channel to stay up to date on breaking news coverage