Join Our Telegram channel to stay up to date on breaking news coverage
The Ankr price prediction is currently changing hands at $0.015 as the technical indicator Relative Strength Index (14) faces the north.
ANKR Prediction Statistics Data:
- ANKR price now – $0.015
- ANKR market cap – $146.4 million
- ANKR circulating supply – 9.66 billion
- ANKR total supply – 10 billion
- ANKR Coinmarketcap ranking – #127
ANKR/USD Market
Key Levels:
Resistance levels: $0.025, $0.027, $0.029
Support levels: $0.007, $0.005, $0.003
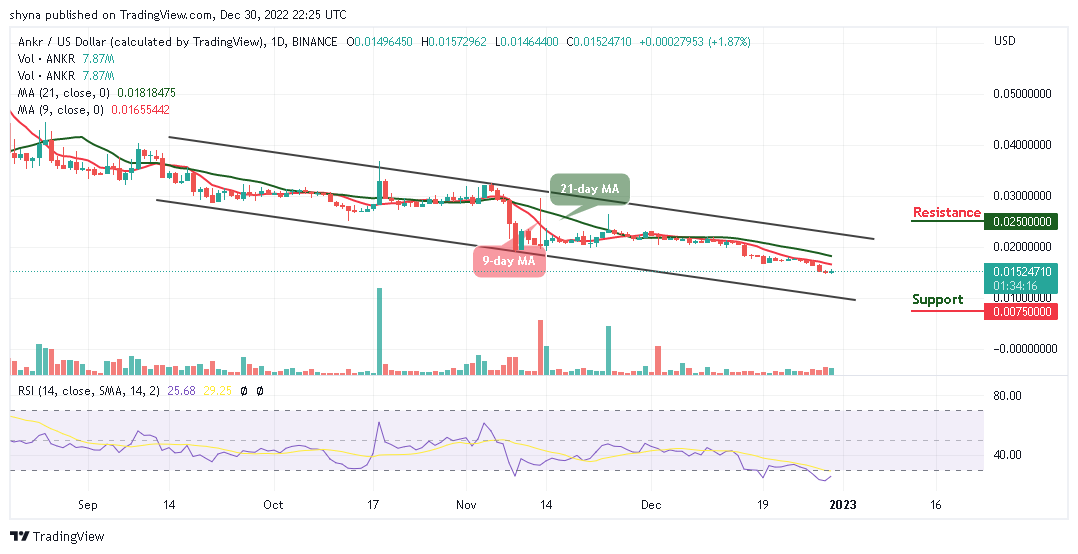
ANKR/USD is trading at around $0.015, and once it crosses above the 9-day and 21-day moving averages, the next target could be located at $0.020 where it could make a bullish cross above the upper boundary of the channel. Meanwhile, a push from the current market value could send the price straight to the resistance level of $0.017, but if the current level fails to hold strong, the Ankr (ANKR) could slip below the support level of $0.013.
Ankr Price Prediction: Is ANKR Ready for the Upside?
Looking at the daily chart, the Ankr bulls are coming into the market, if the buyers put more effort and push the Ankr price above the 9-day and 21-day moving averages, ANKR/USD may likely hit the resistance levels of $0.025, $0.027, and $0.029 respectively. However, any bullish movement above these key resistance levels may encourage further buying.
On the contrary, any bearish movement below towards the lower boundary of the channel may hit the critical supports at $0.007, $0.005, and $0.003. Meanwhile, looking at the technical indicator Relative Strength Index (14), Ankr may exhibit the tendencies to follow an upward trend as the signal line moves away from the oversold region.
Against Bitcoin, the Ankr price is also moving to cross above the 9-day and 21-day moving averages before hitting the nearest resistance at 113 SAT. However, unless this resistance effectively holds and the price ends up closing above the moving averages, there might not be any reason to expect a long-term bullish reversal.
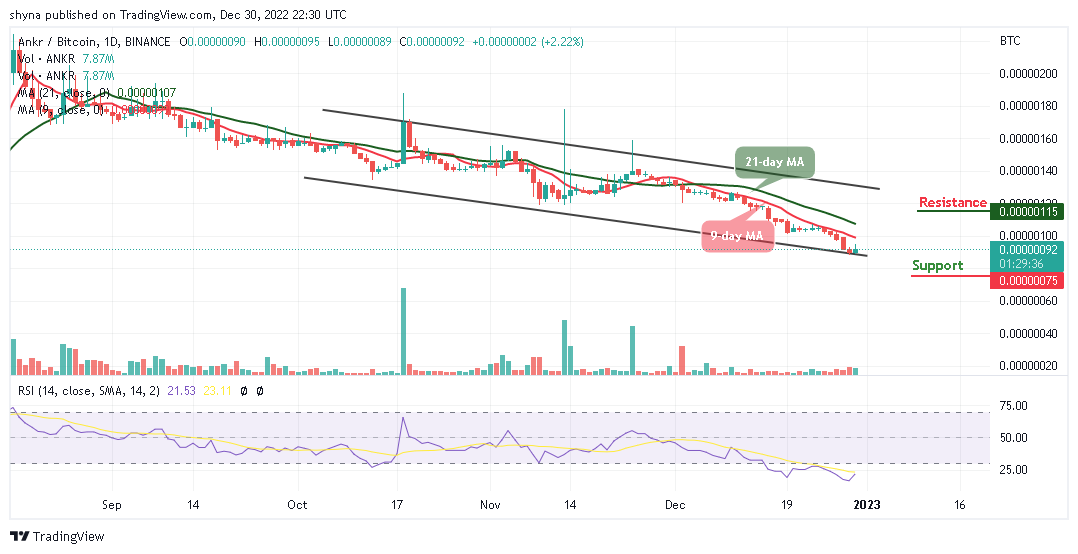
Nevertheless, any bearish cross below the lower boundary of the channel could refresh lows under 90 SAT as a possible bearish continuation could hit the critical support at 75 SAT and below. From above, the buyers may push the coin above the moving averages to hit the potential resistance at 115 SAT and above. Moreover, the technical indicator Relative Strength Index (14) is likely to move away from the oversold region, to confirm the bullish movement.
Best Wallet - Diversify Your Crypto Portfolio

- Easy to Use, Feature-Driven Crypto Wallet
- Get Early Access to Upcoming Token ICOs
- Multi-Chain, Multi-Wallet, Non-Custodial
- Now On App Store, Google Play
- Stake To Earn Native Token $BEST
- 250,000+ Monthly Active Users
Join Our Telegram channel to stay up to date on breaking news coverage