Join Our Telegram channel to stay up to date on breaking news coverage
AMP Price Prediction – September 11
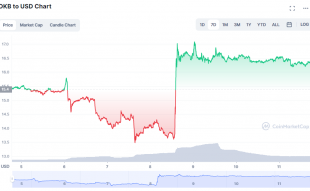
The AMP market has recorded a sudden spike coupling with a correction against the US Dollar, and the crypto market may maintain, building up from the $0.005 support line over time. On June 16, 2021, the market recorded an all-time high of $0.1211 and an all-time low of $0.0007946 on November 17, 2020 (2 years ago). The current percentage rate of trading stands around 10.79 positive.
AMP Price Statistics:
AMP price now – $0.006124
AMP market cap – $259.9 million
AMP circulating supply – 1 million
AMP total supply – 99.2 billion
Coinmarketcap ranking – #126
AMP/USD Market
Key Levels:
Resistance levels: $0.0095, $0.0105, $0.0115
Support levels: $0.005, $0.004, $0.003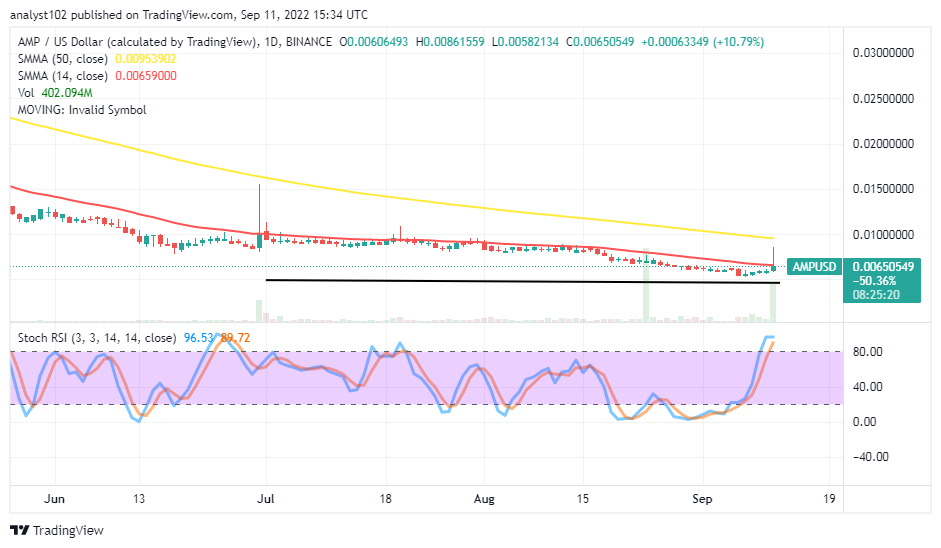 AMP/USD – Daily Chart
The daily chart showcases the AMP/USD market may maintain, building up from the $0.005 support level. The 14-day SMA indicator is at $0.0065 underneath the value line of the 50-day SMA indicator, which is at the point of the $0.0095 range values. The Stochastic Oscillators are in the overbought region, keeping the range points of 89.72 and 96.53 w. The horizontal line has drawn at the $0.005 support level to mark the baseline from which the market tends to be making swing highs.
Your capital is at risk.
Will the AMP/USD market not breach southward past the $0,005 level afterward?
It is technically inclined the AMP market may maintain, building up from the $0.005 level against the US Dollar. With that assumption coming forth to hold firmly, bears may get whipsawed if the price attempts to go below the value line. Bulls need to be wary of following beefing moves on the buying signal side of the 14-day SMA to avoid any timely unnecessary retracements as that has characterized the movements in the past. Investors may consider this moment one of the best times to create or add to their portfolios.
On the downside of the technical analysis, the AMP/USD market sellers have to be on the lookout for an active reversal motion that can follow while a sudden spike surfaces toward the trend line of the bigger SMA from beneath. As of the time of writing, the price is more likely to resume lowly downward precipitation motions around the trend line of the 14-day SMA indicator.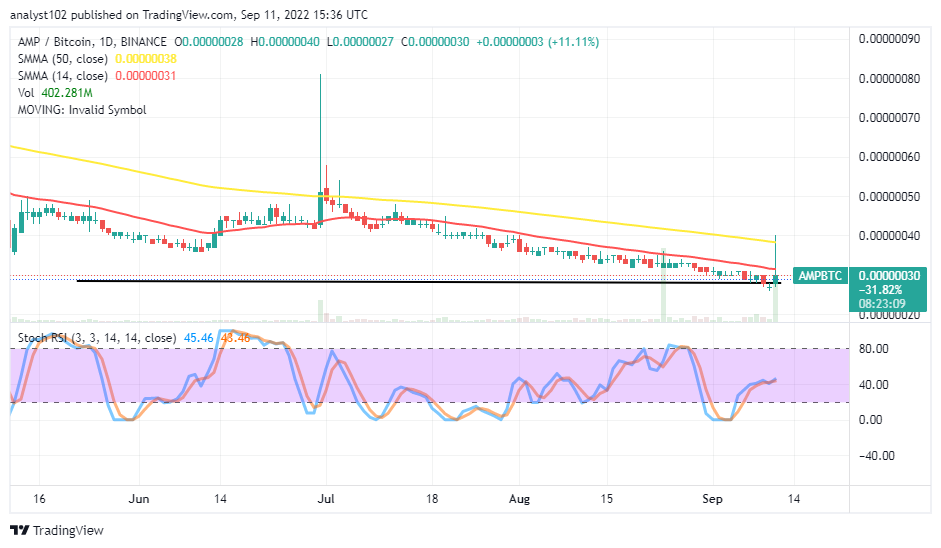
AMP/BTC Price Analysis
The AMP market has been trying to make efforts to shoot northward as it paired with Bitcoin. The cryptocurrency pair market may maintain, building from a lower spot of the drawn horizontal line below the trend lines of the SMAs. The 14-day SMA indicator is underneath the 50-day SMA indicator. The Stochastic Oscillators have conjoined to reach 48.46 and 45.46 range values. A long shadow top has occurred to the trading candlestick to signify the base crypto is losing momentum, pushing against the counter crypto. But, it may not exist for long.
Read more:
Join Our Telegram channel to stay up to date on breaking news coverage