Join Our Telegram channel to stay up to date on breaking news coverage
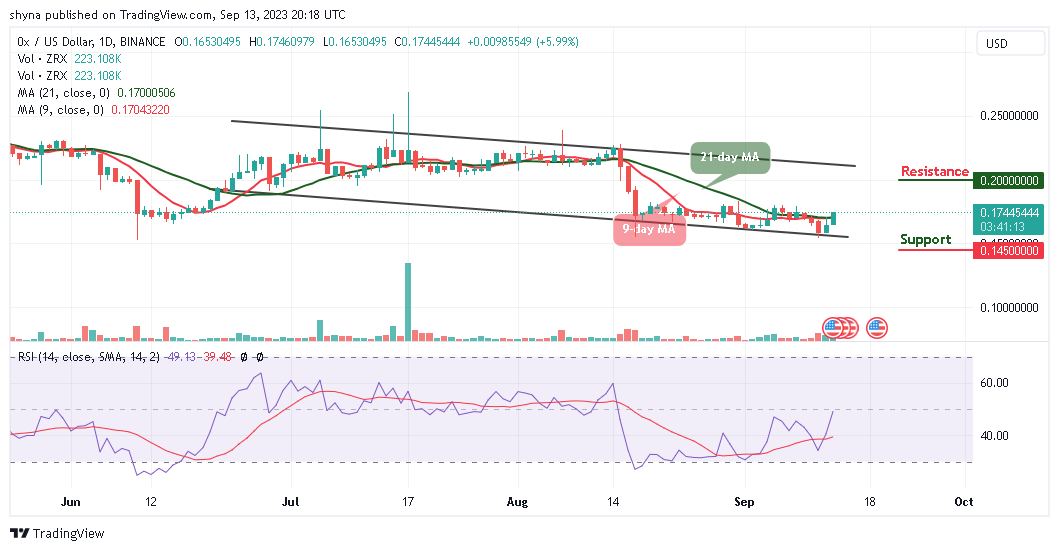
At the time of writing, the 0x price prediction is seen moving above the $0.16 level as the coin crosses above the moving averages.
0x Price Prediction Statistics Data:
- 0x price now – $0.174
- 0x market cap – $148 million
- 0x circulating supply – 847.4 million
- 0x total supply – 1 billion
- 0x Coinmarketcap ranking – #152
ZRX/USD Market
Key Levels:
Resistance levels: $0.200, $0.210., $0.220
Support levels: $0.145, $0.135, $0.125

ZRX/USD touches the daily high at the $0.174 level as the coin faces the path of development since yesterday but the bullish movement can only be confirmed if the market price stays above the 9-day and 21-day moving averages. However, the 0x price is hovering at $0.174 with 5.99% gains in the last 24 hours.
0x Price Prediction: 0x (ZRX) May Gain More
As the daily chart reveals, traders can observe that since the beginning of this month, the 0x price has not been able to display strong bullish momentum as the coin is seen decreasing drastically. Therefore, the 0x price needs to stay above $0.180 consistently for the next few days to regain the proper bullish momentum. However, the technical indicator Relative Strength Index (14) moves to cross above the 50-level, and the signal line is pointing to the north to give more bullish signals.
However, the 0x price only needs to conquer a few crucial resistance levels of $0.180 and $0.190 to stay comfortably at the top. Now, if the coin closely manages these levels well, then it could reach the potential resistance levels at $0.200, $0.210, and $0.220 respectively. On the downside, if the bears wish to maintain their drive, ZRX/USD may likely drop below the lower boundary of the channel, any further bearish movement could drag the coin to the critical supports at $0.145, $0.135, and $0.125.
ZRX/BTC Spikes to the Upside
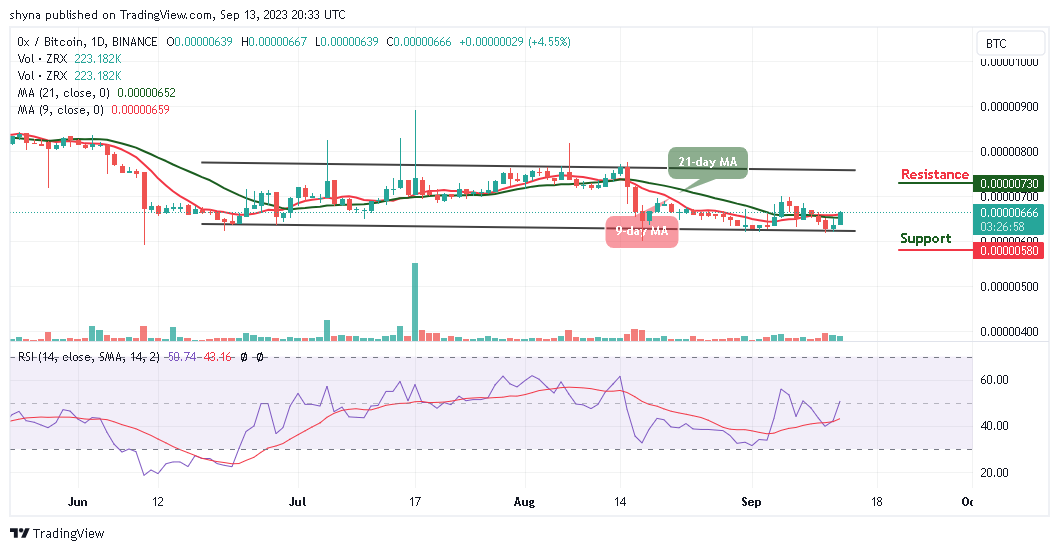
Against Bitcoin, 0x is consolidating above the 9-day and 21-day moving averages as the price changes hands at 666 SAT while the technical indicator Relative Strength Index (14) moves to cross above the 50-level.

However, the daily chart reveals that buyers may continue to have the day as the resistance level to be reached could be 730 SAT and above. On the contrary, a lower sustainable move below the lower boundary of the channel may cancel the bullish pattern and could attract new sellers to hit the support at 580 SAT and below.
Alternatives to 0x
The 0x price moves to cross above the 9-day and 21-day moving averages within the channel. However, the cryptocurrency has been attempting to follow an uptrend, and should the buyers push it toward the upper boundary of the channel, the coin might create additional gains.
Meanwhile, the key distinguishing factor between Wall Street Memes and other meme coins is its overreaching mission – to shake up the traditional financial landscape and give everyday investors more control. Up to this point, the token has amassed a substantial $25 million during its presale phase, with the official launch scheduled for the coming days. For potential investors, the opportune time to get involved is now, not later.
CRYPTOS PLUMMET! This why $WSM is your BEST BET, to recover quickly and make substantial gain.
New OKX Listing - Wall Street Memes
- Established Community of Stocks & Crypto Traders
- Featured on Cointelegraph, CoinMarketCap, Yahoo Finance
- Rated Best Crypto to Buy Now In Meme Coin Sector
- Team Behind OpenSea NFT Collection - Wall St Bulls
- Tweets Replied to by Elon Musk
Join Our Telegram channel to stay up to date on breaking news coverage


