
Join Our Telegram channel to stay up to date on breaking news coverage
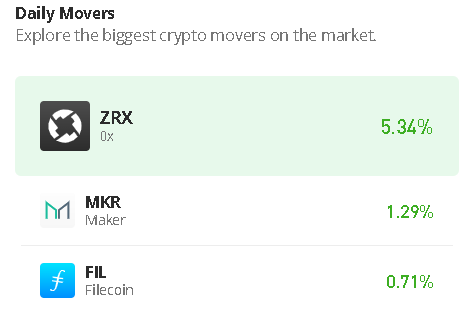
The 0x price prediction may cause the coin to create a new upward movement as the technical indicator heads to the north.
0x Prediction Statistics Data:
- 0x price now – $0.226
- 0x market cap – $191 million
- 0x circulating supply – 847.4 million
- 0x total supply – 1 billion
- 0x Coinmarketcap ranking – #141
ZRX/USD Market
Key Levels:
Resistance levels: $0.280, $0.300, $0.320
Support levels: $0.170, $0.150, $0.130
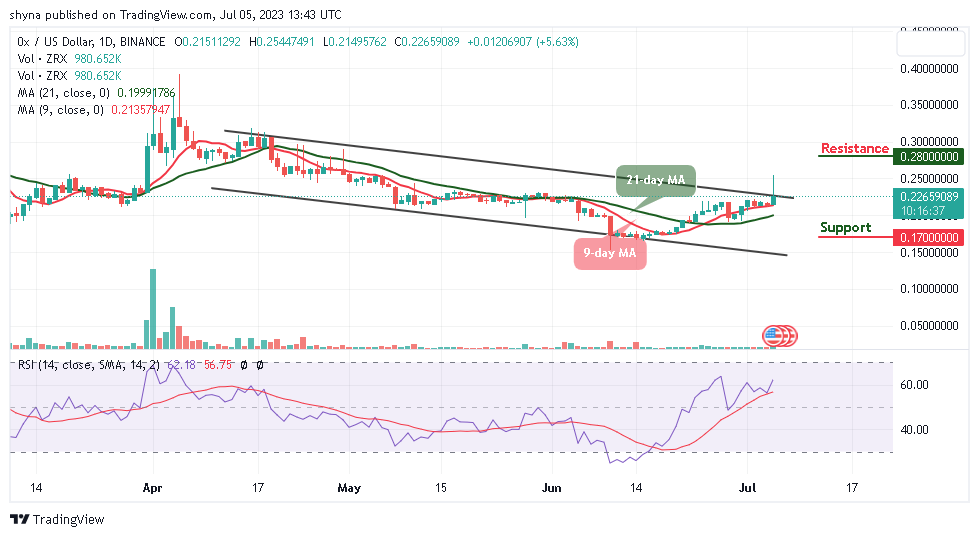
ZRX/USD is currently recovering above $0.220 and it is likely to climb above $0.250 soon. The 0x price is currently hovering above the 9-day and 21-day moving averages as bulls are dominating the market. Meanwhile, the red line of the 9-day MA remains above the green line of the 21-day MA to confirm that the bulls are here for business.
0x Price Prediction: Would ZRX Price Reach the $0.260 Level?
According to the daily chart, the 0x price may continue to create a new uptrend as it is likely for the coin to hit the resistance level of $0.260 if the price crosses above the upper boundary of the channel. Meanwhile, ZRX/USD remains in a bullish position and if the coin stays above the moving averages, it could present more of a chance of bullish movement.
Meanwhile, if the traders could see a tremendous climb above the channel which is fast approaching; it may likely reach the resistance at $0.280, $0.300, and $0.320 levels. On the contrary, dropping below the moving averages may hit the critical support levels of $0.170, $0.150, and $0.130 respectively while the technical indicator Relative Strength Index (14) moves to cross above 60-level.
Against Bitcoin, 0x is following the bullish movement as the coin breaks above the 9-day and 21-day moving averages. The coin is currently experiencing a strong buying power as the buyers increase the pressure. Meanwhile, if the bears return to the market, they may begin to release huge pressure on the market.
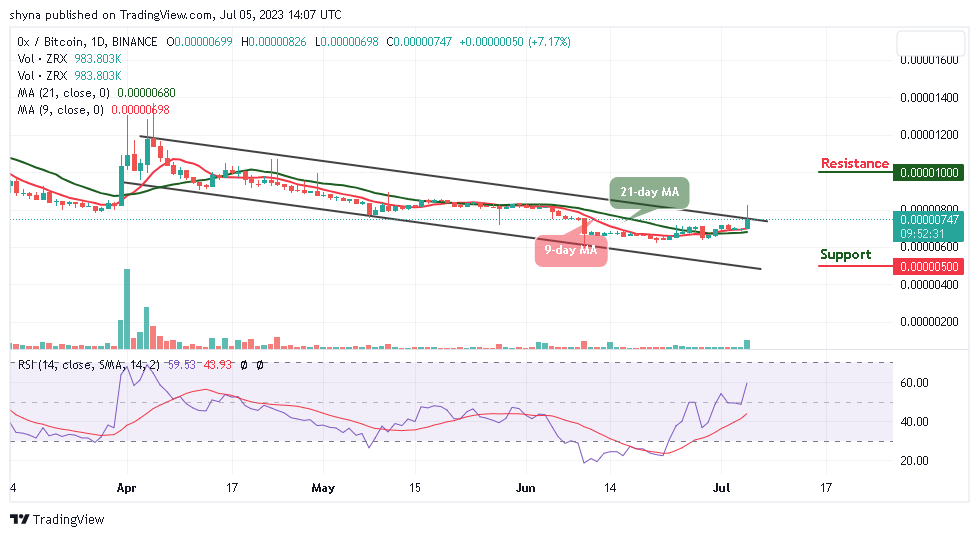
Currently, the technical indicator Relative Strength Index (14) is moving to cross above the 60-level, but should the bears manage to find support at 700 SAT, a downward movement could bring the price to the support level of 500 SAT and below. Nevertheless, a push toward the upside could lead the market price to the resistance level of 1000 SAT and above.
0x Alternatives
The 0x price has been attempting to follow an uptrend, and should the buyers increase the buying pressure, the coin might create additional gains. At the moment, the bullish scenario seems more dominant as buyers continue to post firm commitments into the market.
Meanwhile, Wall Street Memes is a meme coin borne out of the WallStMemes Web2 internet phenomenon which aims to create a decentralized movement that challenges the status quo and puts the control back into the hands of the people. Currently, WSM tokens are in presale and almost $13m has been raised.
Read more:
- Bitcoin (BTC) Price Prediction: BTC/USD Pauses Above $62,000 Support As Bulls Prepare For The Next Round Of Upside Momentum
New OKX Listing - Wall Street Memes

- Established Community of Stocks & Crypto Traders
- Featured on Cointelegraph, CoinMarketCap, Yahoo Finance
- Rated Best Crypto to Buy Now In Meme Coin Sector
- Team Behind OpenSea NFT Collection - Wall St Bulls
- Tweets Replied to by Elon Musk
Join Our Telegram channel to stay up to date on breaking news coverage