Join Our Telegram channel to stay up to date on breaking news coverage
XRP Price Prediction – March 21
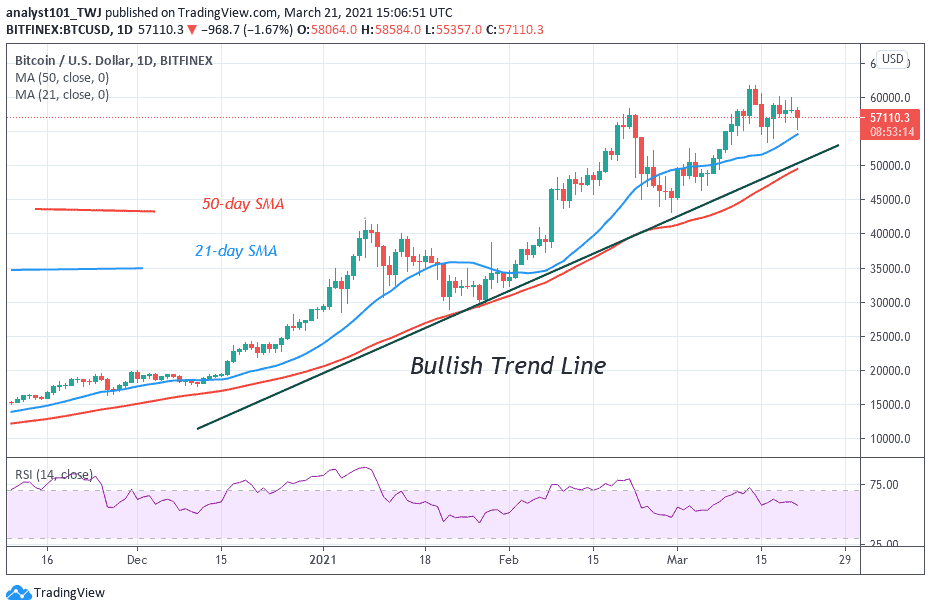
Ripple (XRP) has been down by more than 3.7% in the last 24 hours; the value has gone below $0.51.
XRP/USD Market
Key Levels:
Resistance levels: $0.60, $0.62, $0.64
Support levels: $0.44, $0.42, $0.40
XRP/USD is facing a downward movement at the moment and its current dilapidated condition can be blamed upon the overall gloomy market. Both the 9-day and 21-day moving averages are going below the current price that hints at a delay for bringing a turnaround. Meanwhile, a break in the channel may likely give the market enough strength to dig dip, but the rise might lead the market to a bullish scenario.
What is the Next Direction for Ripple?
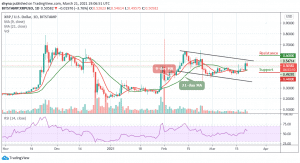
XRP/USD is moving within a descending channel on the daily chart. Technically, the channel formation is a bearish flag pattern that mostly followed a break-down in price. Following the past one day of price actions, XRP is consolidating at the upper boundary of the channel. Currently, the price is bearish but a bounce-back above the channel may locate the resistance levels of $0.60, $0.62, and $0.64.
More so, a price break-down below the moving averages may occur as bears may find new lows at $0.44, $0.42, and $0.40 support levels. From a long-term perspective, Ripple’s XRP is still in a dominant bearish bias. The RSI (14) is showing bearish movement as it is below the 60-level. If the price oscillates downward, XRP/USD may fall back to the $0.48 support level.
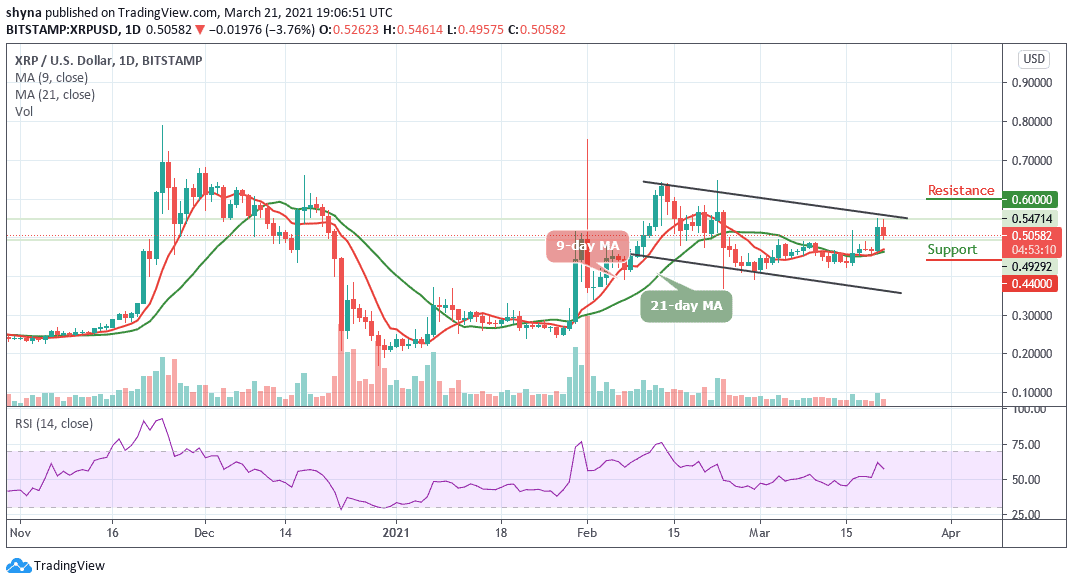
Against Bitcoin, the pair is consolidating within the channel and moving above the 9-day and 21-day moving averages. Meanwhile, the sellers are trying to push the price below the moving average and the bearish continuation may bring it to the support levels of 700 SAT and below.
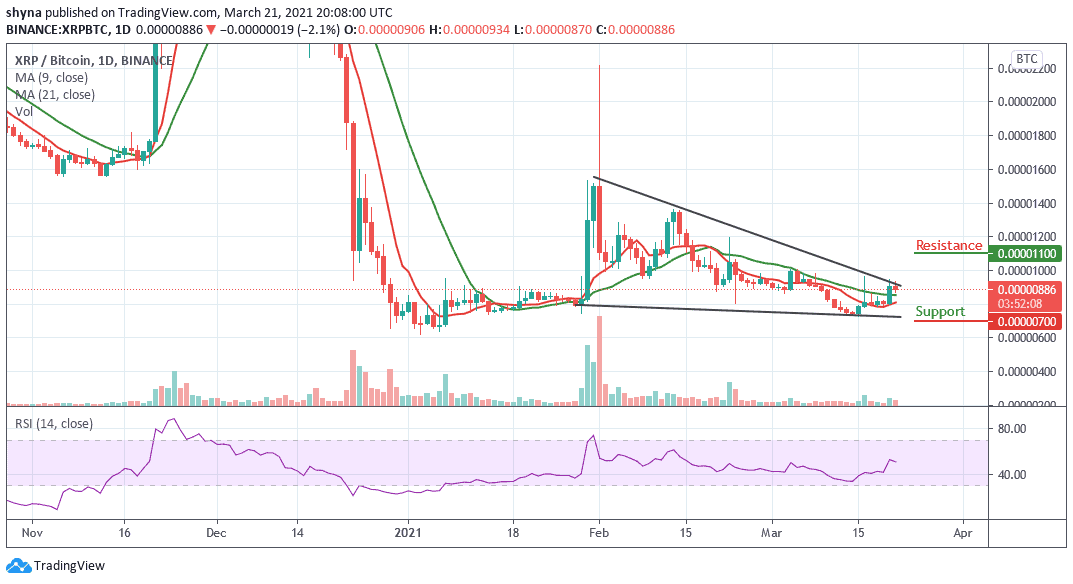
Looking at the daily chart, if the bulls can regroup and push the market towards the north, a possible rise could take the market to the resistance levels of 1100 SAT and 1200 SAT. According to the technical indicator RSI (14), the signal line is moving below 50-level, which suggests that more bearish movement may soon come to play.
Join Our Telegram channel to stay up to date on breaking news coverage