Join Our Telegram channel to stay up to date on breaking news coverage
XRP Price Prediction – February 27
Within 24 hours, Ripple (XRP) is gaining more than 4.12% and the next resistance level may be at $0.50.
XRP/USD Market
Key Levels:
Resistance levels: $0.55, $0.60, $0.65
Support levels: $0.30, $0.25, $0.20
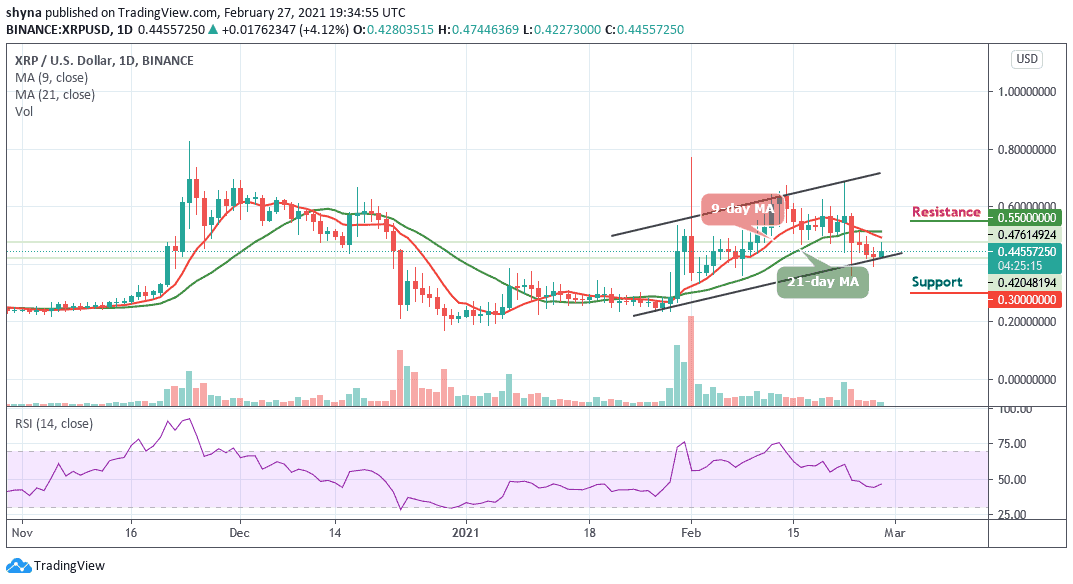
XRP/USD moves from $0.42 to the area above $0.44 in a matter of hours and touched an intraday high at $0.47. While the coin has retreated back to where it is currently trading, although, the pair retains bullish momentum. In the short term, XRP/USD is gaining more than 4.12% since the last 24 hours. Therefore, a sustainable move above $0.48 might improve the technical picture, provided that we see a follow-through and recovery towards $0.50.
Will XRP Break Through $0.50 Resistance Level or Reverse?
Currently, the price of the coin is changing hands at $0.44 level and the bulls are still gathering momentum. Therefore, if the price moves below the lower boundary of the channel, the price could be pushed to the support levels of $0.30, $0.25, and $0.20. Meanwhile, in as much as the green-line of the 21-day moving average is still above the red-line of the 9-day moving average, the Ripple price may continue to be on the bears’ side.
Moreover, the technical indicator RSI (14) is making an attempt to cross above the 50-level, if this possible, then the bullish trend may come to play. More so, should the bulls put more effort to push the XRP/USD higher, further resistance levels may be found at $0.55, $0.60, and $0.65.
When compares with Bitcoin, the Ripple price is consolidating within the channel and moving below the 9-day and 21-day moving averages as the buyers are trying to push the price above the moving averages. Any bullish movement above the moving averages could take the coin to the resistance levels of 1500 SAT and above.
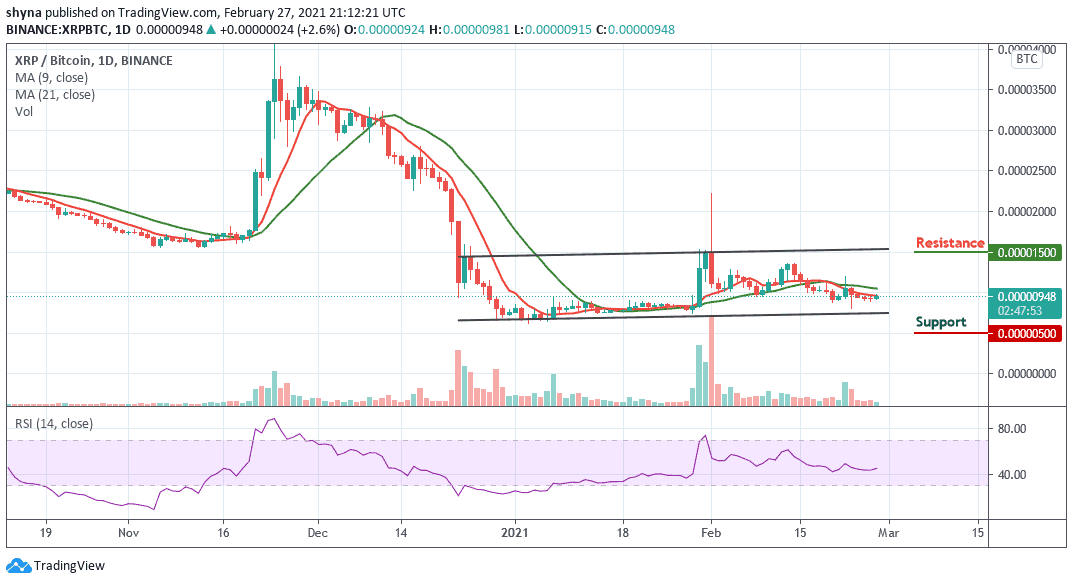
In other words, as the 9-day MA remains below the 21-day MA, crossing below the lower boundary of the channel may cause the market to hit the supports at 500 SAT and below. Meanwhile, the technical indicator RSI (14) is currently seen moving in the same direction, suggesting a sideways move into the market.
Join Our Telegram channel to stay up to date on breaking news coverage