Join Our Telegram channel to stay up to date on breaking news coverage
XRP Price Prediction – February 11
Ripple (XRP) consolidates in a flag formation as the bulls move above the upper boundary of the channel.
XRP/USD Market
Key Levels:
Resistance levels: $0.68, $0.73, $0.78
Support levels: $0.36, $0.31, $0.26
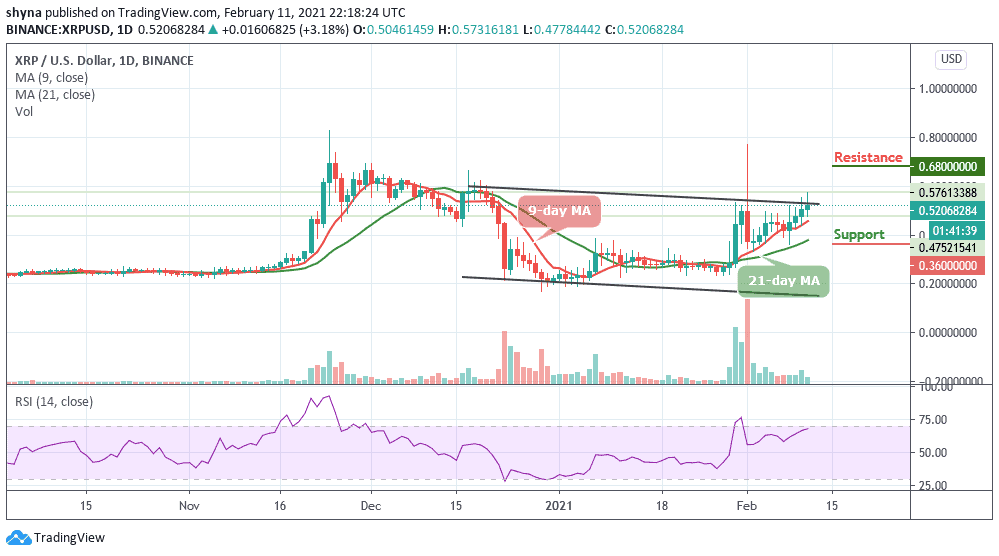
XRP/USD bulls have taken control of the daily price chart following a few day’s bullish movements and the price is attempting to move above the upper channel. Meanwhile, looking at the chart, the coin is presently consolidating in a flag pattern as the trading volume rises slowly.
Where is XRP Price Going Next?
In the earlier of today, XRP/USD begins with a strong increase and breaks many important hurdles near $0.58 and $0.60. Meanwhile, a successful close above the $0.62 resistance level could accelerate gains and the price might surge towards $0.65 and $0.67. Any more gains could lead the price towards the resistance levels of $0.68, $0.73, and $0.78.
On the other hand, if Ripple starts a downside correction, it could find support near the $0.42 level. The first major support is near the $0.40 level, where the bulls are likely to take a stand. However, if the price drops below the $0.38 support level, the pair may likely locate the $0.37 support, which is a close support level for the bears. More so, a bearish continuation could bring the market to the critical supports at $0.36, $0.34, and $0.35 respectively.
Meanwhile, the RSI (14) faces upward, hoping to cross above 67-level which may likely boost the upward movement for the coin.
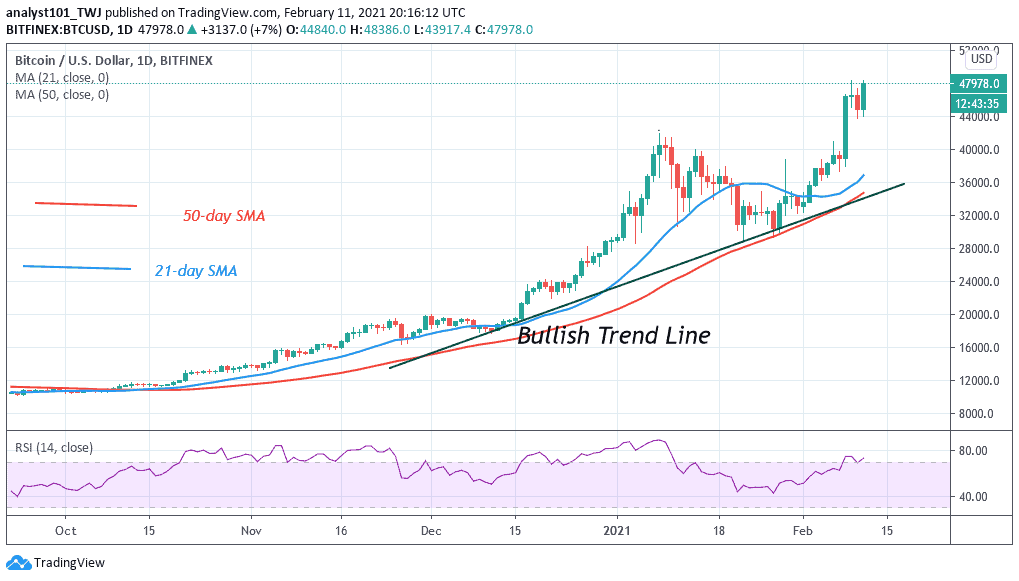
When compares with Bitcoin, the trend of the pair is still sideways in the long-term, trading at around 1103 SAT. Meanwhile, the 4th largest cryptocurrency at the moment is range-bound against USD and the coin may likely hit the support levels at 550 SAT and below if broken the moving averages.
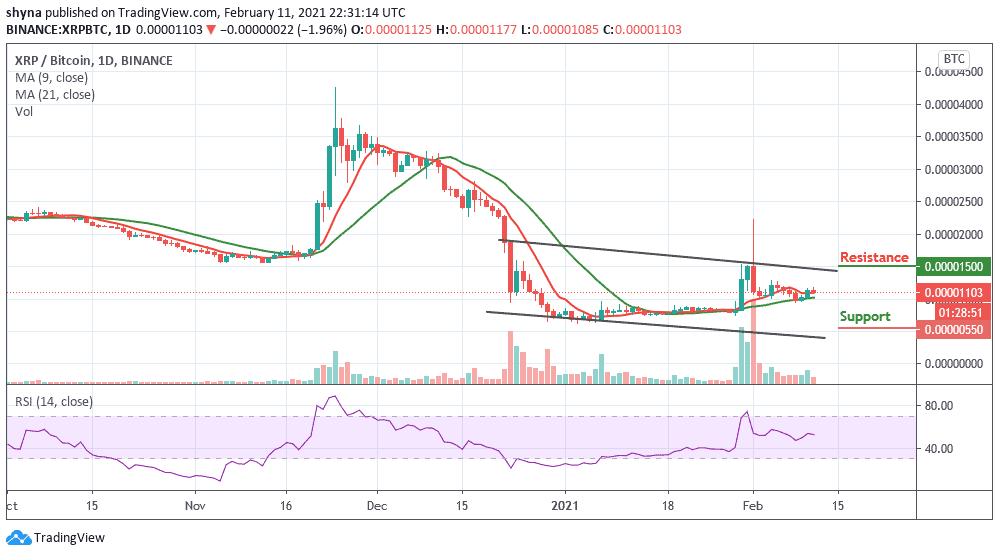
However, if the bulls maintain and hold the price very well, traders can expect the coin to rise above the moving averages. For now, the nearest resistance levels for the market are located at 1500 SAT and above as the RSI (14) moves within the overbought region.
Join Our Telegram channel to stay up to date on breaking news coverage