Join Our Telegram channel to stay up to date on breaking news coverage
XRP Price Prediction – January 29
Ripple (XRP) is recovering above the $0.28 level and it is likely to continue higher towards the $0.40 resistance level.
XRP/USD Market
Key Levels:
Resistance levels: $0.40, $0.42, $0.44
Support levels: $0.20, $0.18, $0.16
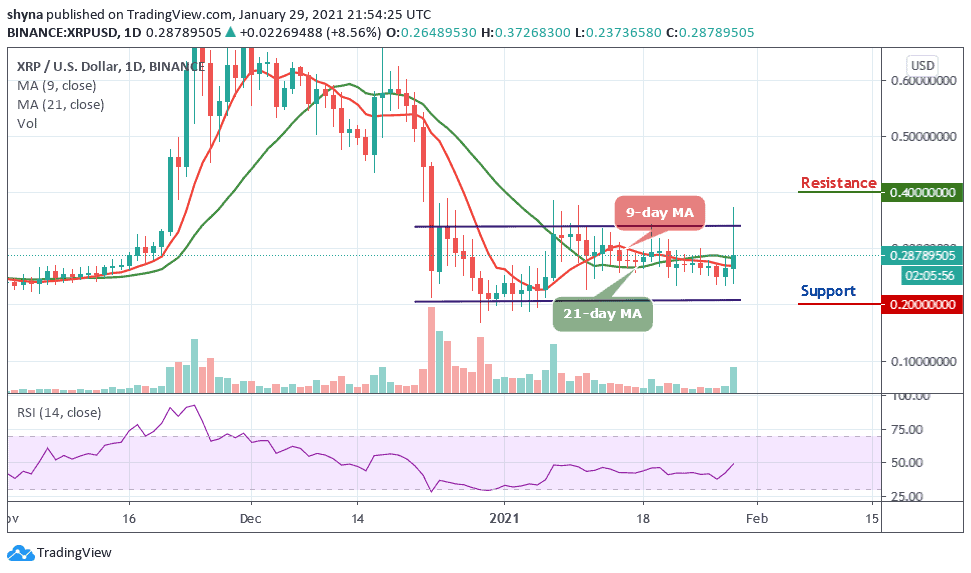
Early today, XRP/USD pushes above $0.35 as the coin penetrated a short-term falling price channel. The cryptocurrency reached as high as $0.37 before it started to head lower. However, XRP/USD falls from $0.37 and now dropping back into the previous short-term declining channel. More so, this decline may likely continue as the coin could penetrate back beneath $0.30 in other to reach the support at $0.23 below the 9-day and 21-day moving averages.
What to Expect from Ripple (XRP)
While the coin remains below the $0.30 psychological and technical resistance, it may remain range-bound and the cryptocurrency could double in the next positive moves within the market, this means that the coin may soon near $0.50 if the bullish movement continues. More so, the price seems to be following a rising channel with support near $0.25 on the daily chart.
Meanwhile, as the technical indicator RSI (14) faces the north, the nearest resistance is near the $0.35 level, above which the price might cross above the upper boundary of the channel to test the potential resistance levels at $0.40, $0.42, and $0.44. In other words, if the price fails to remain above the moving averages, it may likely see a sharp-drop below the lower boundary of the channel and move towards the supports of $0.20, $0.18, and $0.16s respectively.
When compares with Bitcoin, the Ripple price is moving sideways as the price action remained within the channel. If the coin continues to move around the 9-day and 21-day moving averages, the Ripple price variation may remain stagnant within the channel. At the moment, the RSI (14) is range-bound as the signal attempts to cross above the 40-level.
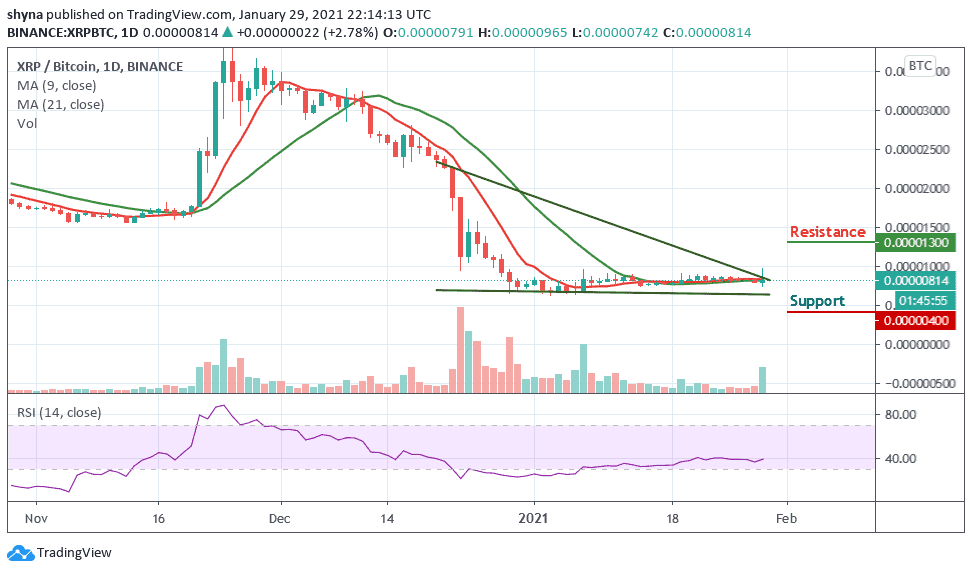
As the daily chart reveals, XRP/BTC is currently moving at 814 SAT which is around the lower boundary of the channel. Traders may expect close support at the 400 SAT and below and should in case a bullish movement occurs and validates a break above the moving averages; traders can then begin a bull-run for the market and the nearest resistance levels are located at 1300 SAT and above.
Join Our Telegram channel to stay up to date on breaking news coverage