Join Our Telegram channel to stay up to date on breaking news coverage
XRP Price Prediction – January 13
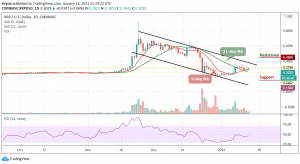
The daily chart reveals that the Ripple price is range-bound as bulls fail to move the cryptocurrency to a new height.
XRP/USD Market
Key Levels:
Resistance levels: $0.50, $0.55, $0.60
Support levels: $0.15, $0.10, $0.005

According to the daily chart, XRP/USD is trading above the 9-day and the 21-day moving averages, the coin is also floating within the middle of the channel as the RSI (14) indicator moves in the same direction below the 50-level. The daily breakdown shows that the intraday support and resistance lie between $0.28 and $0.30 respectively.
What to Expect from Ripple (XRP)
Moreover, the Ripple price continues to demonstrate a sign of weakness across its markets. But on the other hand, the coin is up with 3.66% gains, reflecting a price rise in the market trading above the 9-day and 21-day moving average and the rise might become heavy if the bullish action continues. Meanwhile, around six days ago, the fourth largest-cryptocurrency has witnessed a bullish drive against the USD.
However, since the XRP/USD is moving in sideways, the trend may likely advance higher if the current price holds and remain above the moving averages. A channel breakout could strengthen the bulls and push the price to the resistance levels of $0.50, $0.55, and $0.60 whereas a break below the moving averages might lead the market in a bearish scenario if the price continues to fades, it may likely reach the closest supports at $0.15, $0.10, and critically $0.005.
When compares with Bitcoin, the Ripple price is currently consolidating within the 9-day and 21-day moving averages. However, if the bulls could energize and push the price above the moving averages, the bullish continuation may likely take it to the resistance levels of 1500 SAT and above.
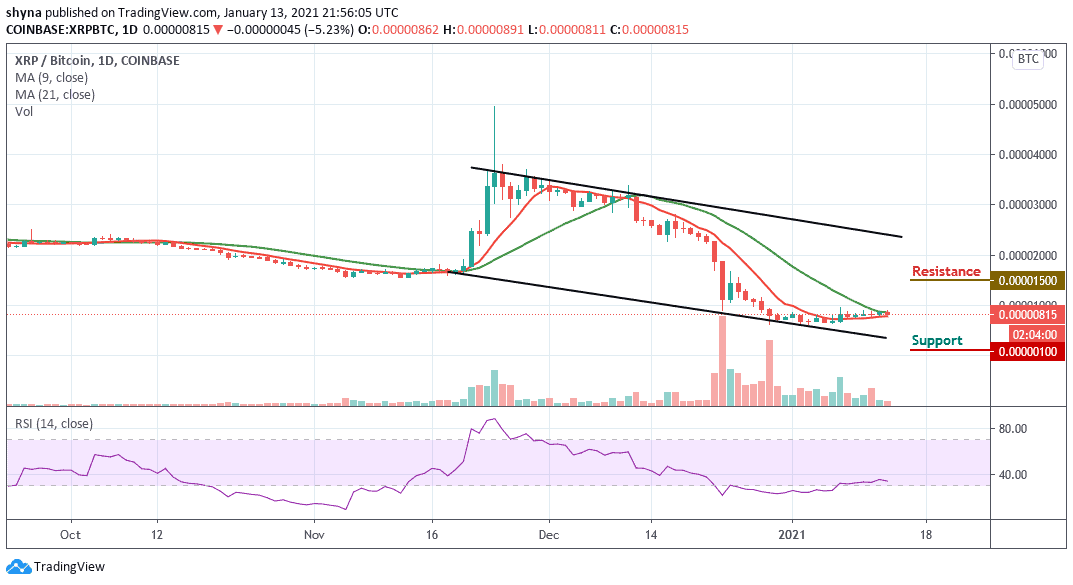
According to the daily chart, if the bulls failed to hold the price, then the market price may likely fall below the lower boundary of the channel and the nearest support levels for the coin are located at 100 SAT and below. Meanwhile, the RSI (14) continues to move below 35-level, which indicates a sideways movement.
Join Our Telegram channel to stay up to date on breaking news coverage