Join Our Telegram channel to stay up to date on breaking news coverage
XRP Price Prediction – January 11
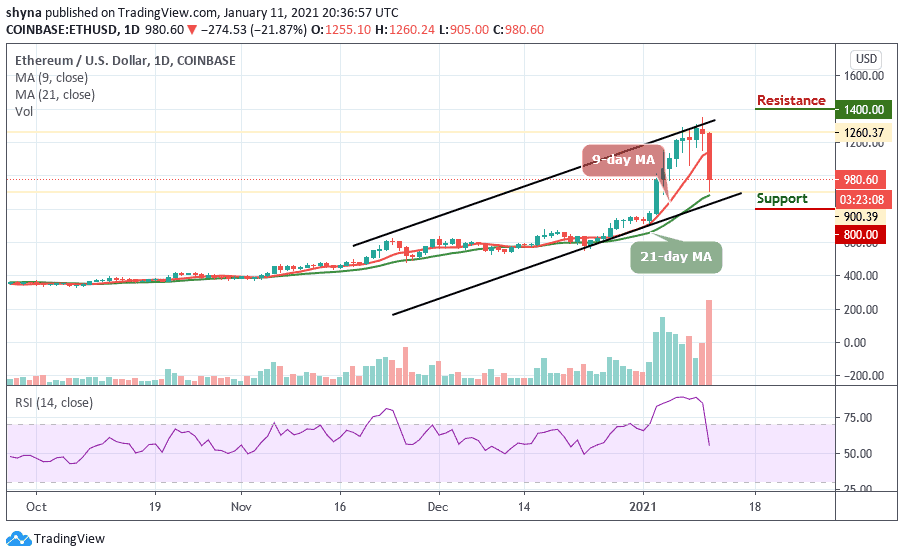
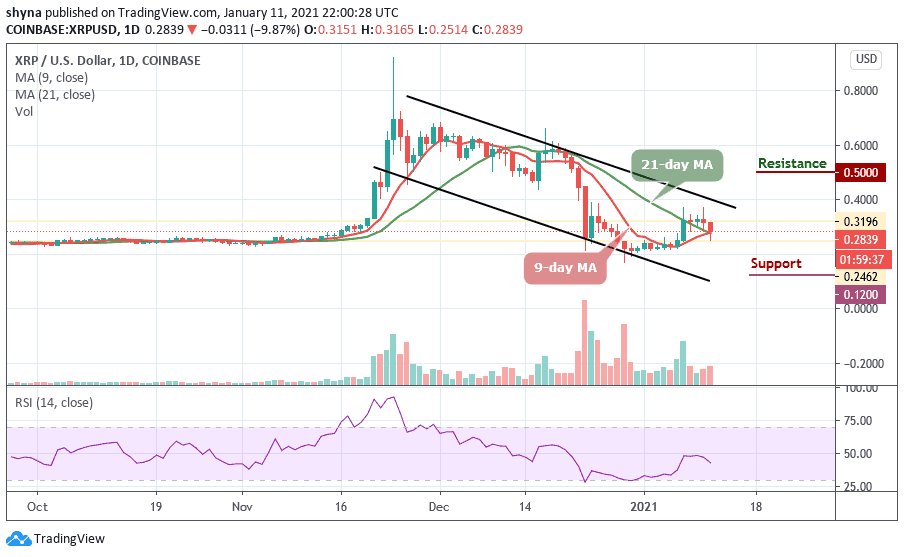
At the time of penning down this prediction, XRP/USD is seen trading at $0.283. Meanwhile, the market price lacks imminent support and may trade in the red with dense selling pressure.
XRP/USD Market
Key Levels:
Resistance levels: $0.50, $0.52, $0.54
Support levels: $0.12, $0.10, $0.08
XRP/USD price is seen correcting downwards after having hit the resistance at $0.369 yesterday. The king of the cryptocurrencies (Bitcoin) is also seen trading below $31,000 and has an impact on the overall trading volume and market cap as well. At the moment, the Ripple price is exhibiting an intraday dip and bearish move, alongside, lack of support.
Where is XRP Price Going Next?
The daily chart reveals that the coin is seen correcting downwards after starting the day at $0.315. The bulls couldn’t push XRP/USD higher to hit the nearest resistance, the coin is moving towards the major support at $0.250. In addition, once the coin rightly gains the required momentum, it may likely bounce back and retest the formed resistance.
At the moment, the technical indicator RSI (14) faces the south with its signal lines moving below 45-level. Meanwhile, should the bulls prevail over the bears by moving the price back to $0.40, therefore, XRP/USD pair may rally towards the resistance levels of $0.50, $0.52, and $0.54 respectively. If the bears continue to push the price below the 9-day and 21-day moving averages; the price could find its low at the support levels of $0.12, $0.10, and $0.08 respectively.
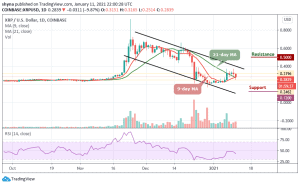
Against Bitcoin, for a few days now, Ripple (XRP) has been following the sideways movement around the moving averages but today, the bulls are trying to step back into the market as they are trying to maintain an upward movement above the 9-day moving average. Traders may expect the price-rise to 1500 SAT and above should the price cross above the 21-day MA.
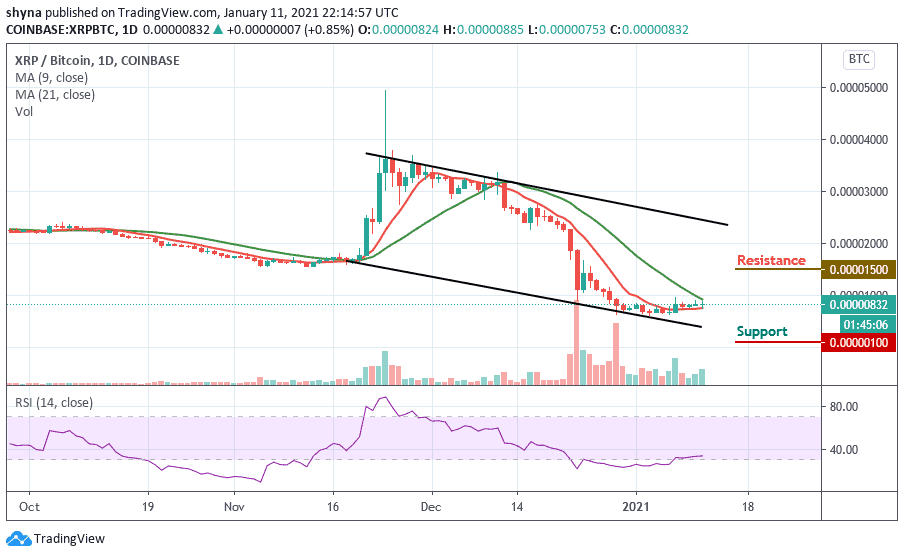
However, if the sellers continue to push the price below the lower boundary of the channel, the next support level is located at 300 SAT and further support is found at 100 SAT and below. Meanwhile, the RSI (14) is moving around the 34-level, which may likely cause the coin to range-bound.
Join Our Telegram channel to stay up to date on breaking news coverage