Join Our Telegram channel to stay up to date on breaking news coverage
XRP Price Prediction – November 17
Ripple (XRP) is pushing higher and the bulls look firmly in control but there looks to be decent volume behind the move and the RSI (14) moves into the overbought zone.
XRP/USD Market
Key Levels:
Resistance levels: $0.32, $0.33, $0.34
Support levels: $0.28, $0.27, $0.26
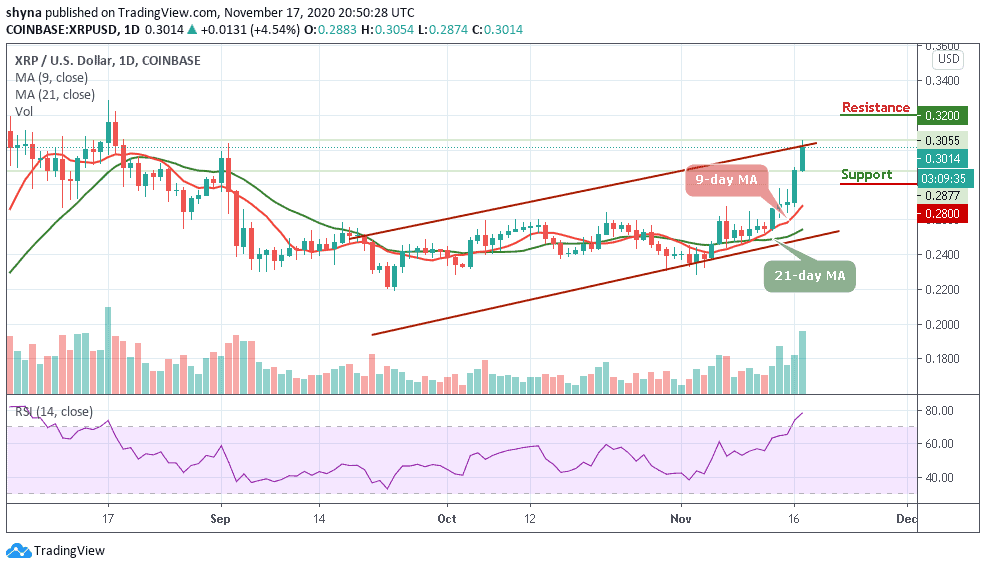
Today, XRP/USD jumps from $0.288 to the area above $0.300 in a matter of hours and touched an intraday high at $0.305. While the coin retreats to $0.301 at the time of writing, the pair retains bullish momentum. In the short term, XRP/USD has gained more than 4.54% in the last 24 hours and currently, one of the best-performing coins out of the top 10.
What to Expect from Ripple (XRP)
Due to a strong upside movement of the coin, Ripple’s XRP broke free from the recent downtrend some days ago and tested the highest level since November 4, 2020. The 9-day and 21-day moving averages are now serving as strong support for the coin. If the price moves toward this direction, the coin may visit the support levels of $0.28, $0.27, and $0.26.
Currently, the price of the coin is changing hands at the $0.301 level and the bulls are still in the control. Moreover, the RSI (14) moves into the overbought condition, which will continue to give more bullish signals as further movement may take the market to the nearest resistance levels of $0.32, $0.33, and $0.34 respectively.
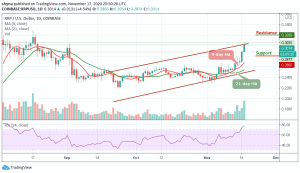
Against BTC, XRP is consolidating within the channel, trading above the 9-day and 21-day moving averages at 1704 SAT. Although the bulls are making effort to push the price across the upper boundary of the channel, should in case they succeed, they may likely hit the resistance levels of 1900 SAT and 2000 SAT respectively.

Looking at the daily chart, if the buyers failed to hold the price, the coin may likely fall below the moving averages; further dropping could bring it towards the lower boundary of the channel to meet the nearest support levels of 1500 SAT and 1400 SAT. Meanwhile, the technical indicator RSI (RSI) is moving below the 50-level, which may likely suggest more downtrends.
Join Our Telegram channel to stay up to date on breaking news coverage