Join Our Telegram channel to stay up to date on breaking news coverage
XRP Price Prediction – November 10
At the moment, XRP/USD is targeting the $0.26 level but in case the bulls succeeded in breaking up the resistance level of $0.27 then $0.28 may be the next target.
XRP/USD Market
Key Levels:
Resistance levels: $0.28, $0.29, $0.30
Support levels: $0.23, $0.22, $0.21
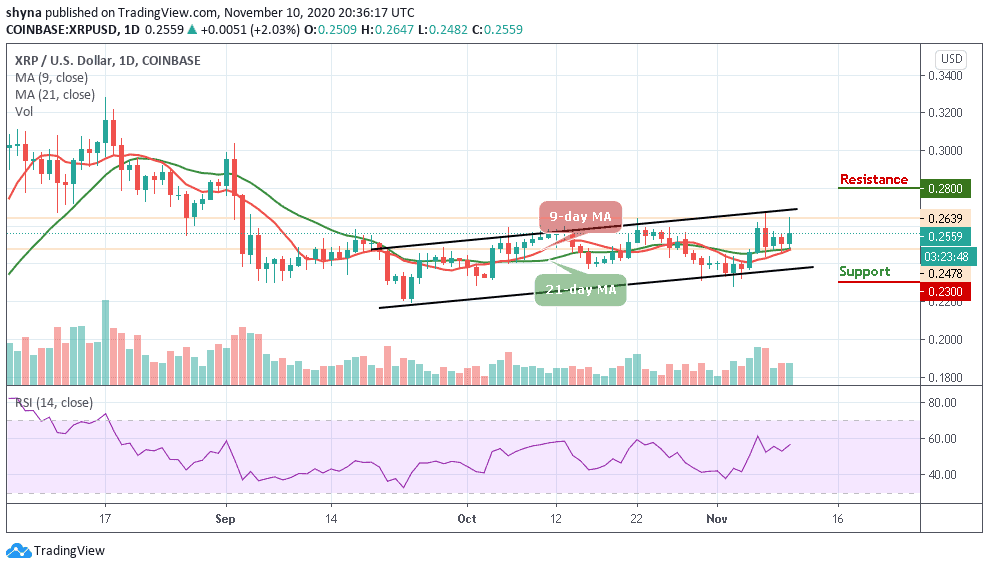
XRP/USD is currently at $0.255 right below a critical barrier at $0.26, which has been tested several times. A breakout above this point may drive the Ripple price towards the higher level of $0.30. However, the market price is hovering above the 9-day and 21-day moving averages which confirms that the bulls are still in-charge of market control.
Where is XRP Price Going Next?
According to the daily chart, the Ripple (XRP) needs to crack $0.26 for good. Meanwhile, XRP/USD has pierced through the critical resistance level at $0.26 several times in the past but never managed to close above it. In other words, a break is expected below the 9-day and 21-day moving averages to send the price lower to $0.24, and breaking the lower boundary of the channel may hit the support level of $0.23, $0.22, and $0.21 respectively.
For the upside, the buyers need to make a sustainable move above $0.27 as soon as possible to resume back into the upward trend. However, for the upside to gain traction, the coin needs to regain ground above $0.28, while $0.29 and $0.30 resistance levels are the ultimate aims for the bulls.
Against Bitcoin, the Ripple (XRP) has been slowly grinding higher as the technical indicator RSI (14) is making an attempt to recover from the oversold region. The price begins to slowly ascend and it’s currently trading around the 1669 SAT. The Ripple price is now contained within the descending channel as traders wait for the bulls to hopefully push the price above the 9-day moving average.
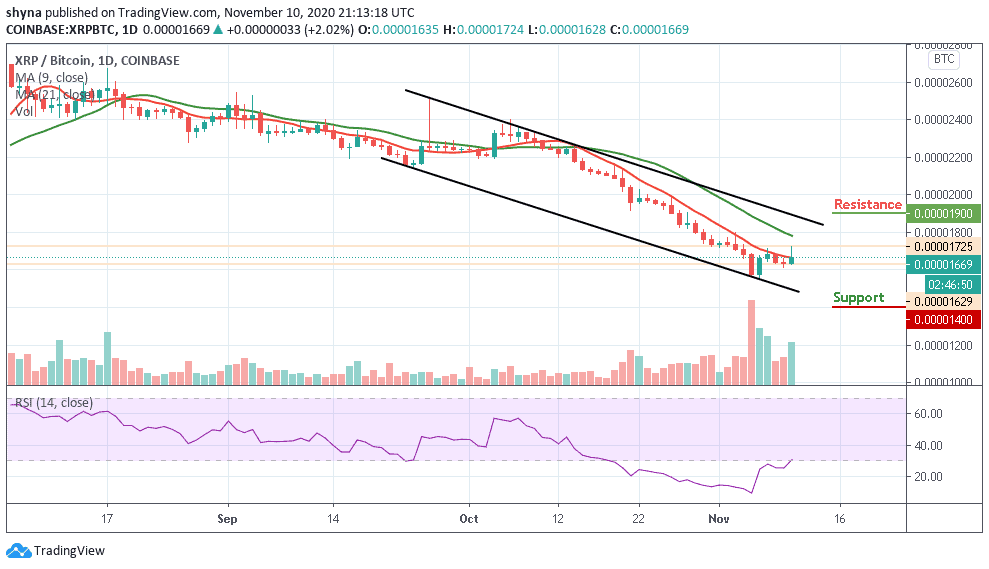
Moreover, if the bulls break above the moving averages, we can expect initial resistance at 1800 SAT. Above this, higher resistance lies around the 1900 SAT and above. From the downside, if the sellers drag the market price beneath the lower boundary of the channel, we can expect supports at 1400 SAT and below.
Join Our Telegram channel to stay up to date on breaking news coverage