Join Our Telegram channel to stay up to date on breaking news coverage
ETH Price Prediction – November 10
The Ethereum (ETH) seems to be ready for the downward move throughout the short-term consolidation phase seen in the past few days.
ETH/USD Market
Key Levels:
Resistance levels: $485, $495, $505
Support levels: $400, $390, $380
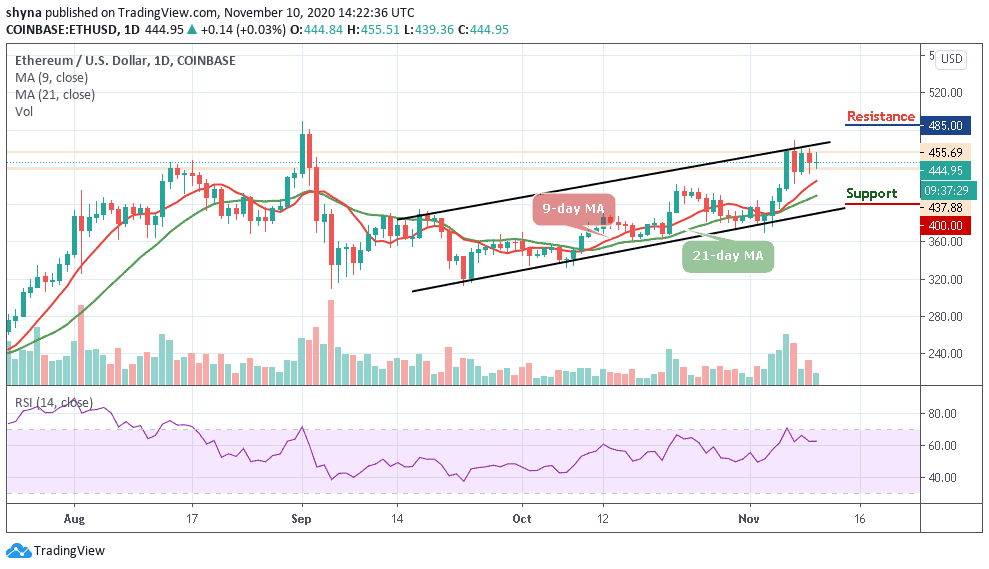
ETH/USD may likely follow the downward movement as the coin is been bitten by the bears. The coin opened at $444.84 today and initially dropped below $440 before striking a surge above $450 touching the daily high of $455. Presently, ETH/USD is moving sideways as the market price remains above the 9-day and 21-day moving averages.
Where is ETH Price Going Next?
Traders are still expecting a lot from this crypto, although the price movement from the past trading days reflected an improvement in ETH prices. The daily chart reveals that both the Ethereum and the Bitcoin started with a drop today. More so, the coin is currently trading around the upper boundary of the channel while exchanging hands at $444.95 which is yet to break the channel.
In addition, a bearish drop below the moving averages may likely roll the market down to $400, $390, and $380 support levels while a possible bullish surge may drive the market across the channel. Above this, $485, $495, and $505 may further provide resistance levels for the market. Meanwhile, the RSI (14) is moving in the same direction above 40-level, suggesting sideways movement.
Against Bitcoin, the market price remains in the descending channel and the bears are dominating the market. ETH/BTC is currently trading at 0.0292 BTC and the bulls are finding it so difficult to push the price upward. Looking at the chart, if the market continues to drop, the next key supports may likely be at 0.270 BTC and below.
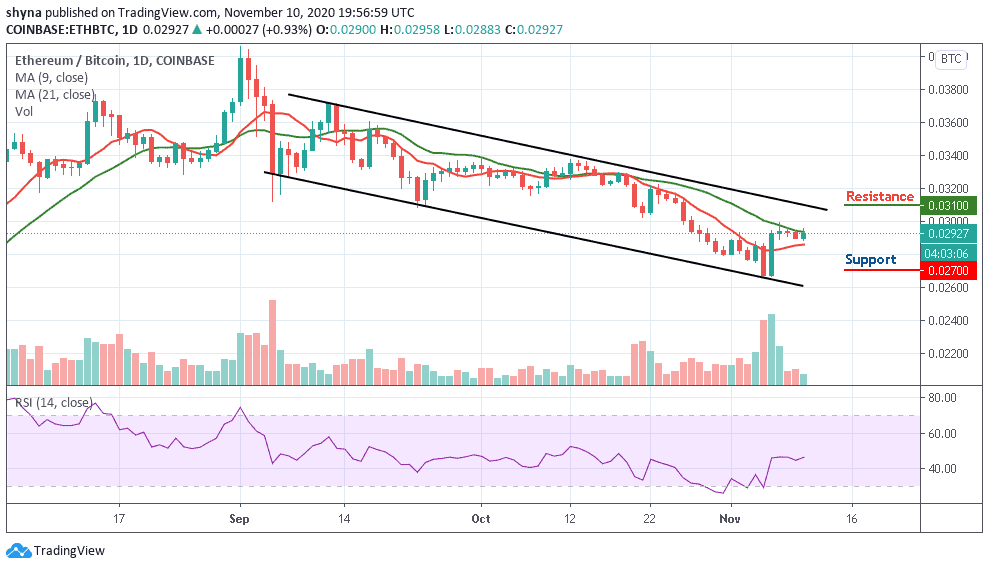
On the upside, a possible bullish movement above the moving averages could push the market towards the upper boundary of the channel, once this is done, the resistance level of 0.0310 BTC and above could be visited but the RSI (14) is seen moving around the 40-level, suggesting a sideways movement.
Join Our Telegram channel to stay up to date on breaking news coverage