Join Our Telegram channel to stay up to date on breaking news coverage
Bitcoin (BTC) Price Prediction – November 10
The Bitcoin price is struggling to recover above $15,700 but the coin remains at a risk of a larger breakdown below the $15,000 support.
BTC/USD Long-term Trend: Bearish (Daily Chart)
Key levels:
Resistance Levels: $16,800, $17,000, $17,200
Support Levels: $14,000, $13,800, $13,600
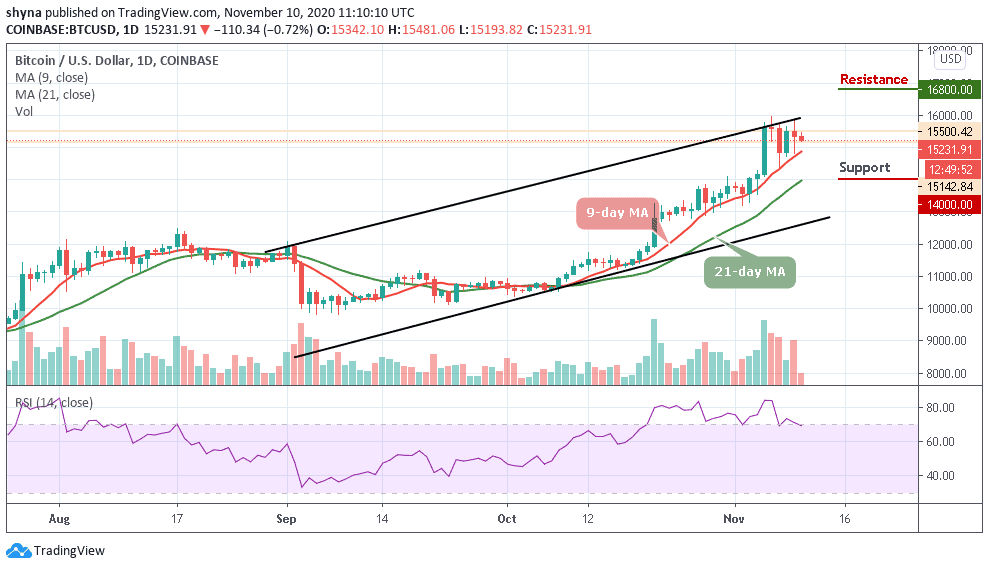
BTC/USD has been struggling to maintain its position above $16,000 but its price sees another dive below the $15,400 mark today. This battle comes after the coin tried and failed to extend gains past $16,000 which happened to be the daily high some few days ago. The Bitcoin price is back under $15,500 and currently changing hands at $15,231. Meanwhile, the Bitcoin price remains above the 9-day and the 21-day moving averages within the ascending channel.
Where is BTC Price Going Next?
An upside break above the upper boundary of the channel is a must to start a substantial recovery. However, the next hurdles may be seen near the resistance levels of $16,800, $17,000, and $17,200. On the downside, initial support is below the 9-day moving average and if there is a successful break below the support level of $14,500, the bears are likely to gain strength by bringing the price to a low of $14,000, $13,800, and $13,600 respectively.
Currently, the Bitcoin price follows a dominant bearish bias and a glance at the technical indicator RSI (14) reveals that the market may experience more downtrend if the signal line crosses below the 70-level.
BTC/USD Medium – Term Trend: Ranging (4H Chart)
BTC/USD trades within the range of $14,600 to $15,800. Nevertheless, Bitcoin has not yet slipped below $15,000 and is still in the loop of making a bounce back. BTC price hovers around $15,225 and may take time to persistently trade above $15,500. The upward movement is facing hurdles near the $15,700 and $15,900 resistance level.
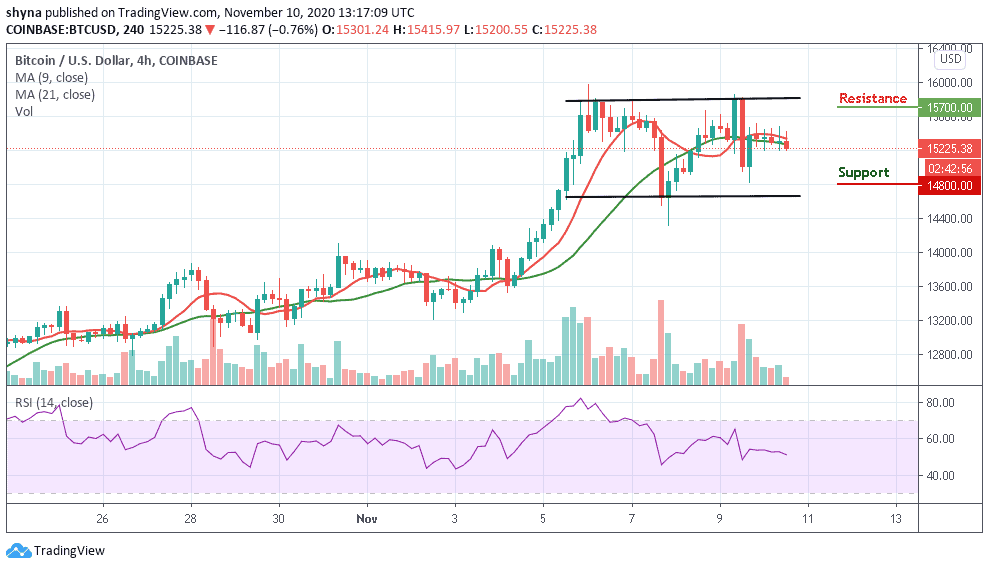
However, on the downside, immediate support is near the $15,000 level while the main support is at the $14,800 level. The price might slide sharply below $14,600 which may likely test another support at the $14,400 level. Technically, Bitcoin is poised for more losses in the near-term as the RSI (14) is currently moving sideways, waiting for the next direction.
Join Our Telegram channel to stay up to date on breaking news coverage