Join Our Telegram channel to stay up to date on breaking news coverage
XRP Price Analysis – October 27
The bulls and bears are currently wrestling for control over the past few days.
XRP/USD Market
Key Levels:
Resistance levels: $0.280, $0.290, $0.300
Support levels: $0.225, $0.215, $0.205
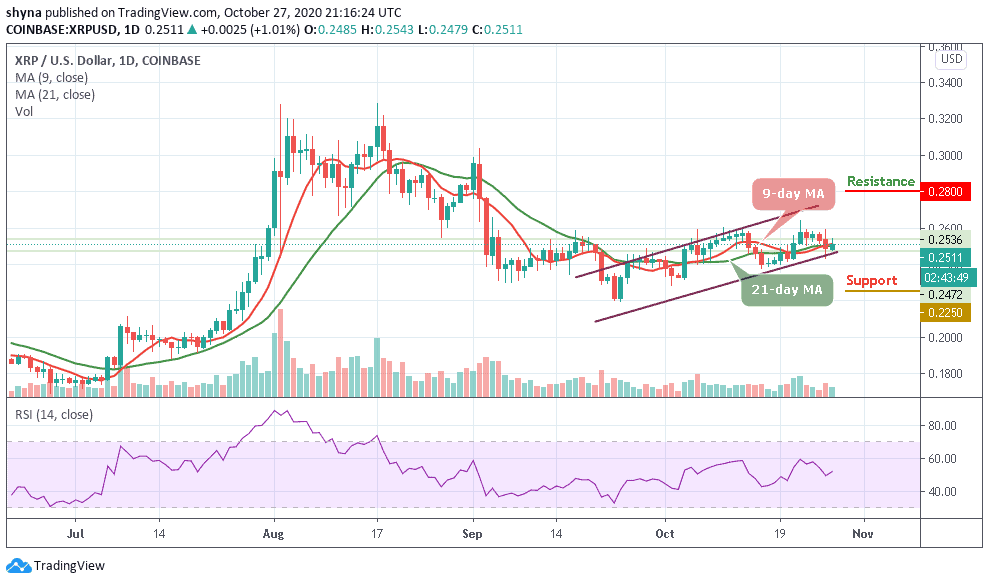
XRP/USD is slowly trading around the 9-day and 21-day moving average. The Ripple price may likely touch the support of $0.240 before any further rise begins. After trying to stay above $0.250 a few days ago, XRP/USD has been maintaining the sideways movement.
What is the Next Direction for Ripple?
The Ripple (XRP) is currently trading at $0.251 and any attempt below the moving averages could open the door to drop below the lower boundary of the channel and the price could fall below the $0.240 support level. However, traders need to keep an eye on the $0.235, and $0.230 before moving upwards while the resistance levels lie at $0.280, $0.290, and $0.300.
Moreover, the market may experience a quick-buy as soon if the trade could reach the $0.250 support. And if the price fails to rebound, then a bearish breakout is likely to trigger more selling opportunity for traders, which might cause the price to retest $0.225 and could further drop to $0.215 and $0.205 support levels respectively. The RSI (14) is moving above the 50-level, therefore, XRP/USD may climb further.
Against BTC, XRP moves at the downside, actually, the price action has remained intact within the descending channel. If the selling pressure continues, the XRP price variation may continue with the downward trend. At the moment, the RSI (14) is moving within the oversold region; traders may continue to see a negative move in the market in as much as the 9-day (red-line) MA stays below the 21-day (green-line) MA.
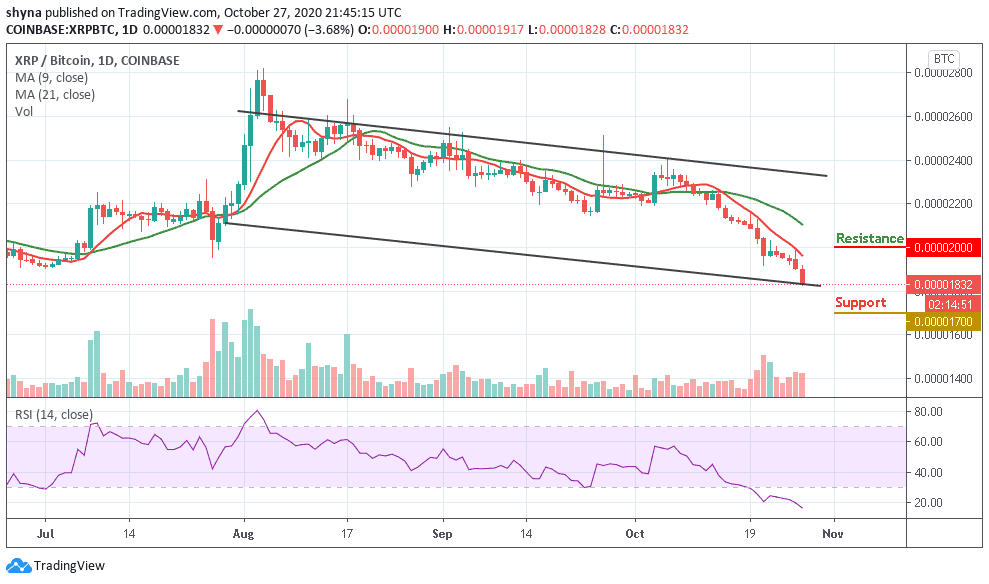
However, the coin is currently trading below the moving averages with the channel at the 1833 SAT. We may expect close support at the 1800 SAT before breaking to 1700 SAT and critically 1600 SAT levels. Should in case a bullish movement occurs and validates a break above the moving averages; we can then confirm a bull-run for the market and the nearest resistance levels to reach lies at 2000 SAT and above.
Join Our Telegram channel to stay up to date on breaking news coverage