Join Our Telegram channel to stay up to date on breaking news coverage
ETH Price Prediction – October 27
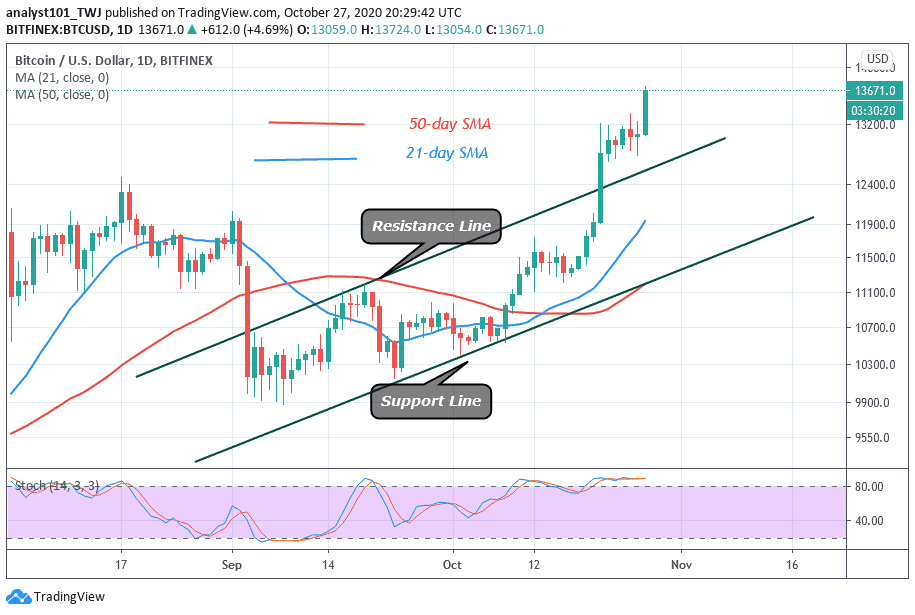
The Ethereum price is seen climbing higher and settling above the main $400 barrier.
ETH/USD Market
Key Levels:
Resistance levels: $450, $460, $470
Support levels: $355, $345, $335
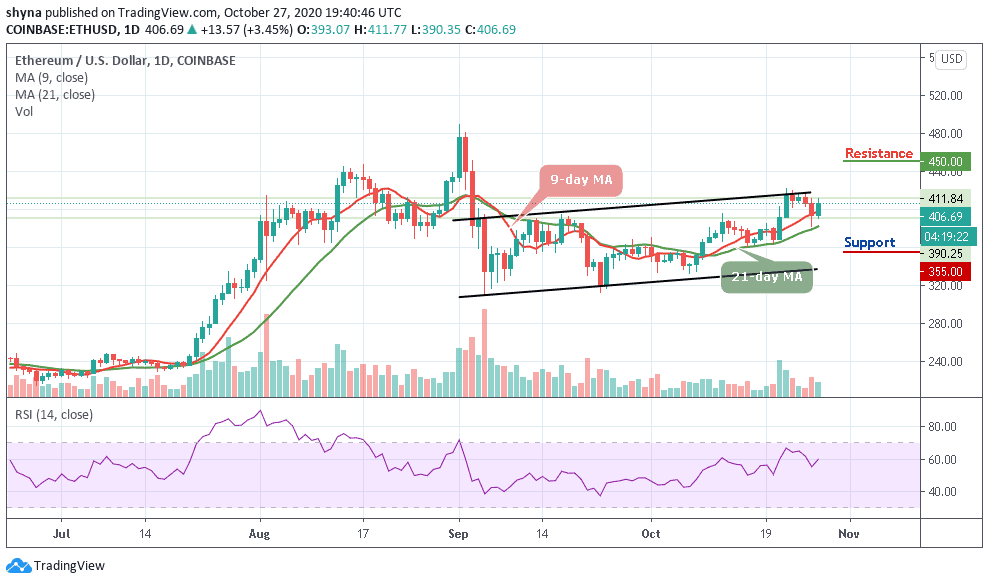
ETH/USD may continue to move above the 9-day and 21-day moving averages until it finds resistance at the level of $420. The fact remains that the Ethereum coin may continue to move at the upside in as much as the 9-day MA stays above the 21-day MA. Nonetheless, the price can still rise higher and break above the upper boundary of the channel if the bulls put more effort.
What to Expect from Ethereum (ETH)
If the buyers continue to add more pressure to the market, an initial resistance is expected at $425. Above this, further resistance can be found at $450, $460, and $470 levels. On the other hand, the moment the bears step back into the market and cross below the moving averages, initial support is located below the $370. Beneath this, additional supports are expected at $355, $345, and $335.
More so, the RSI (14) is trying to cross above the 60-level which shows that the bullish momentum may continue. On other hand, if the technical indicator fails to cross above the 60-level then the bears stand a chance to return back into the market. However, if it remains within this range, the cryptocurrency may begin a sideways movement.
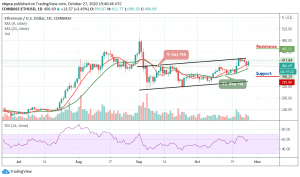
Against Bitcoin, ETH is experiencing some difficulties, especially in the past few days. The Ethereum (ETH) recently broke under the 9-day and 21-day moving averages and may continue to fall towards the subsequent support of 3000 SAT. The critical support level is found around 2900 SAT as the RSI (14) moves into the oversold region.
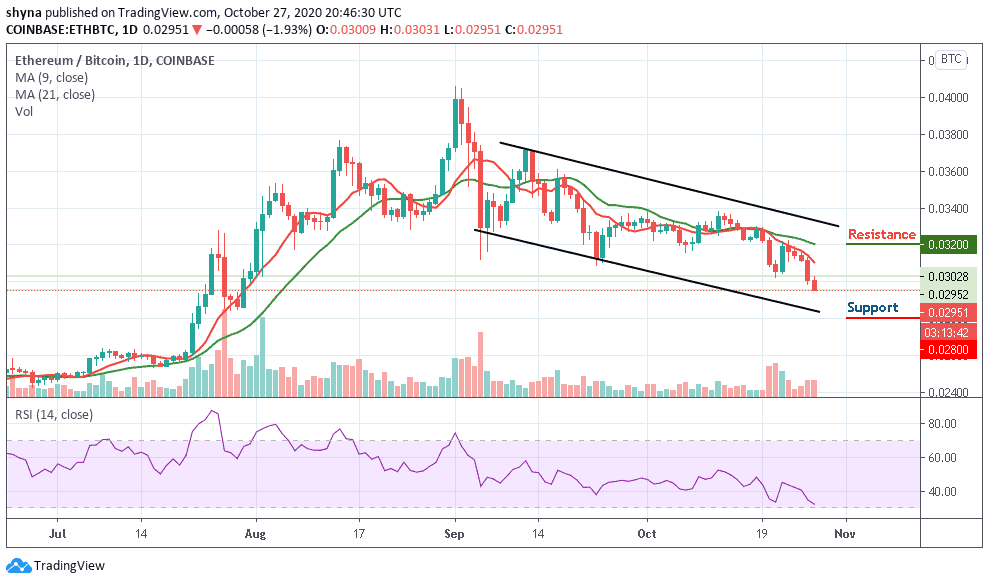
However, ETH/BTC remains below the moving averages as it fails to rebound higher above the 3031 SAT. However, if it continues to drop beneath this level, then the market would be considered as bearish and could reach the critical supports at 2800 SAT and below. To turn bullish, ETH must rise much higher and break above the 3200 SAT level and above.
Join Our Telegram channel to stay up to date on breaking news coverage