Join Our Telegram channel to stay up to date on breaking news coverage
XRP Price Prediction – April 4
The market worth of XRP/USD has in the long run strived to push northbound to touch the peak line of $0.65 yesterday, April 3. But, shortly, price reversed to now trade around a close lower trading zone of $0.60 mark.
XRPUSD Market
Key Levels:
Resistance levels: $0.65, $0.70, $0.75
Support levels: $0.45, $0.40, $0.35
XRP/USD – Daily Chart
Presently, the XRP/USD daily trading chart shows that the main resistance has been established around the level of $0.65. There have been several erratic bullish reversals on the buy signal side of the smaller SMA trend-line. The 50-day SMA trend-line is located underneath the 14-day SMA trading indicator. And, they now slightly point towards the north. The Stochastic Oscillators have placed at range 80 to seemingly getting set for a consolidation moving mode around it. That signifies that to some extent, more buying pressures are being played out at the expense of the loss of bears’ weaknesses in the crypto-economy.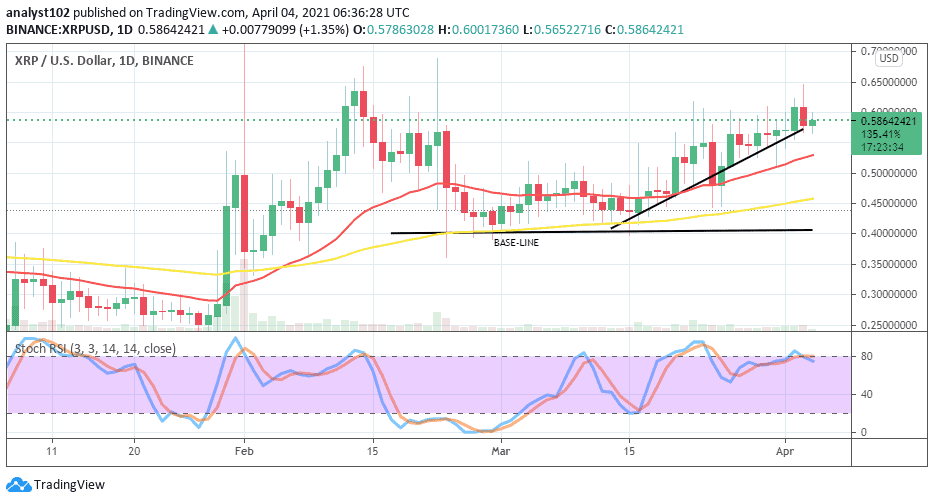
Will XRP/USD market witness a further tangible decline below the $0.65mark?
The XRP/USD bulls may now be finding it difficult to breach northwardly past the major resistance level of $0.65. However, prolong-trading settings around the market line of 0.55 may potentially lead to letting in more buying pressures which could result in northbound pushes to tune of a higher point of $0.70. The appropriate bullish reversal trading pattern does expectantly not have to get below the level of $0.50 for the long run.
Analyzing the flip trading trend, the XRP/USD bears will be having a better strike while price is resisted at a high point during a very active action. Similarly, at this point of trading time, there is every tendency that the crypto’s value may be put under pressure in the form of previous reversal moving format. All in all, traders need to put up with a precautionary trading measure as regards any sell entry.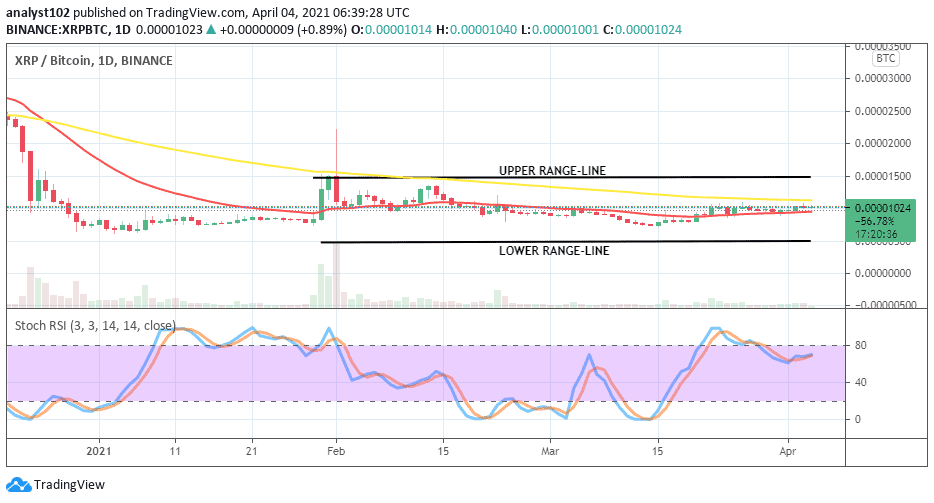
XRP/BTC Price Analysis
The XRP/BTC trading chart yet shows a long keep of definite range zones between the two instruments in comparison. Nevertheless, there has been a slight sign that the base-crypto has been relatively pushing against the counter-crypto within the range-bound trading zones as of writing. Both the SMAs are also kept within well-defined zones. The 14-day SMA trend-line lays a bit flat over the 50-day SMA that also wears almost the same trending outlook as they point to the east direction to affirm the current ranging trend of the cryptos as compared. The Stochastic Oscillators have closely formed by conjoining the hairs in a slanting manner from the overbought region down a bit below the range 80. Yet, they still maintain the formation to showcase an ongoing price move in the market. Being as it is, the range-trading mode appears not to change in a near session.
Join Our Telegram channel to stay up to date on breaking news coverage