Join Our Telegram channel to stay up to date on breaking news coverage
XRP Price Prediction – April 17
An amazing financial record has been made in the XRP/USD market valuation as the crypto sets on a visible stride since it broke out of the last upper range line at $0.60 on April 5 trading session.
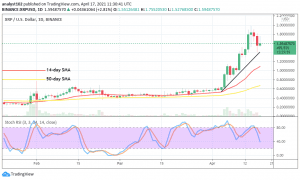
XRPUSD Market
Key Levels:
Resistance levels: $2, $2.20, $2.40
Support levels: $1.20, $1, $0.80
XRP/USD – Daily Chart
There has been a formation of variant successive of bullish candlesticks above the most higher low price of $0.60 until now. The bullish trend-line has drawn to make a point at $1.40 over the SMAs’ trendlines. The 14-day SMA indicator is closely located underneath the bullish trend-line. And, the 50-day SMA indicator is situated at a lower point a bit above the $0.60 support line. The Stochastic Oscillators have crossed the hairs from a point a bit over range 80 towards range 40. But, they now appear attempting to make a close that could in the near time suggest a return of bullish continuation move in the crypto trading activities. 
Will there soon be a bullish correctional move to put the XRP/USD below the $1.40 level?
As there has been a kind of ongoing market correctional moving outlook in the XRP/USD valuation, the price has seemingly encountered support at the $1.40 level. That line has the potentiality of letting the bulls make a pull-up that will signal a clear-cut of the bullish trend. However, the tested trading level of $2 will remain vital in the furtherance of the upward continuation move afterward.
The XRP/USD may be having it tighter in determining the early formation of sell-off entries while talking about the downside of this crypto-market currently. The US Dollar seems to have its chance now to put the crypto under pressure to break down below the $1.40 value. Failure to exert more pressure at this point will let in the lost catalyst to seeing a gradual return of the upsides continuation move.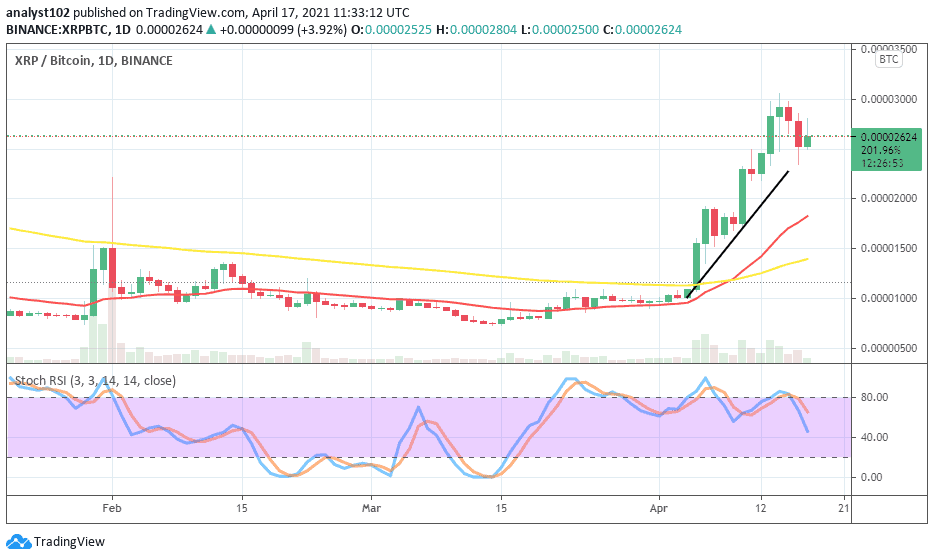
XRP/BTC Price Analysis
The XRP/BTC trading chart shows that there is a sharp increase in the market worth of Ripple XRP as compared with the BTC’s. About a couple of days’ sessions, there has been an emergence of bullish candlesticks on the buy signal side of the SMA trading indicators. The interception of the 50-day SMA trend-line from below by the 14-day SMA trend-line keeps on a stronger promissory note to get to see more ups in a near session. The Stochastic Oscillators have slightly crossed from range 80 towards range 40 to possibly cross the hairs back to the north. If that assumption plays out, there will be a return of valid upward price movements.
Join Our Telegram channel to stay up to date on breaking news coverage