


Join Our Telegram channel to stay up to date on breaking news coverage
Bitcoin Price Prediction – April 16
There has been a touch of the $65,000 price resistance level and also a revisit of the late long-featuring resistant line of $60,000. The revisit of the $60,000 occurs in today’s session.
BTC/USD Market
Key Levels:
Resistance levels: $65,000, $70,000, $75,000,
Support levels: $55,000, $50,000, $45,000
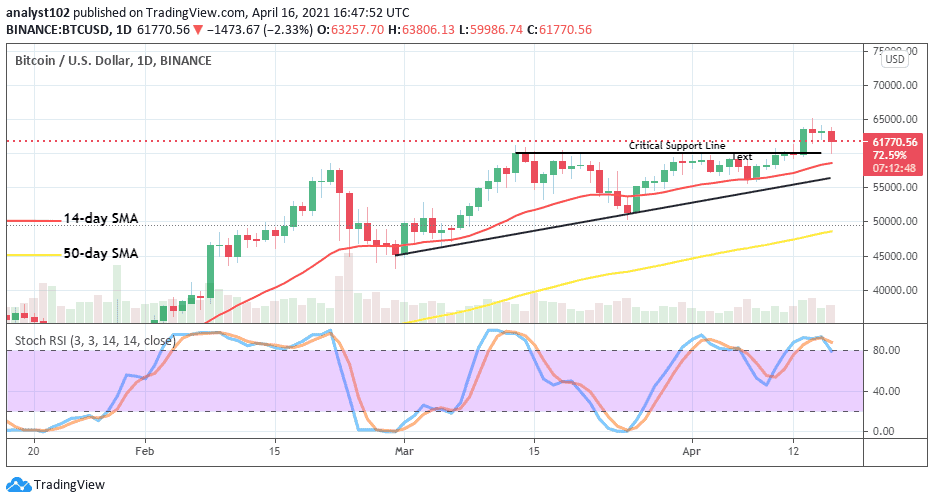
BTC/USD – Daily Chart
It has now been found technically okay to have a critical support line drawn at the vital price level of $60,000. As of the present, the crypto’s value seemingly drops to relocate its stance in the market in conformity with the formation of a buy signal created by the April 13 bullish candlestick. Both the 14-day SMA trend-line and the bullish trend-line aren’t breached to the south yet and, that suggests that hope is still brighter on the side of getting to see more upsides. The 50-day SMA still points to the north far below the other indicators. The Stochastic oscillators have are placed in the overbought region to cross the hairs near range 80. That currently signifies a small featuring of higher lows that may still be experienced in the near time
.
Will the BTC/USD price be caged between the levels of $65,000 and $60,000 trading zones?
From the technical viewpoint, it is presently appeared that the BTC/USD market risk the potentiality of witnessing variant range-bound moves around or within the levels of $65,000 and $60,000 as both the two price movers are seemingly not putting much-required efforts to push out of the two trading lines as of writing. That said, a pull-back that occurred to touch the lower value of $60,000 has shown that the bulls seem not giving up the momentum so easily.
The downward market move of this crypto-pair will require the bears to re-intensify efforts by building up a resistant barrier at that higher level of $65,000. However, a sudden breakout of that point may let the market be more visibly overwhelmed by upsides. In the event of that, selling entry will be to be suspended until another rejection is spotted at a later higher value.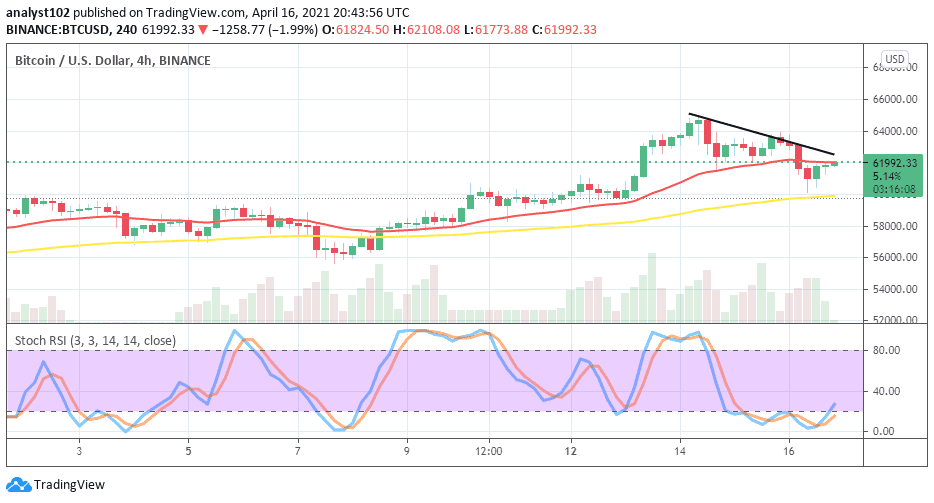
BTC/USD 4-hour Chart
It is at this point been shown on the medium-term trading chart that the BTC/USD market is at the verge of completing its run of correctional move. Price has fallen relatively past the 14-day SMA trend-line to seemingly find support around the 50-day SMA near the $60,000 level. It is still indicated that the bulls are taking their time to make a pull-up move from the depth of slight decline. The stochastic Oscillators are down in the oversold region to now briefly consolidate below range 20. But, there is an indication that the bulls are making a strong effort to recover its recently lost momentum
Join Our Telegram channel to stay up to date on breaking news coverage
