

Join Our Telegram channel to stay up to date on breaking news coverage
XRP Price Prediction – September 15
XRP/USD bears have stayed in control of the market as the price falls from $0.249 to $0.242.
XRP/USD Market
Key Levels:
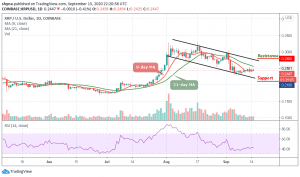
Resistance levels: $0.28, $0.29, $0.30
Support levels: $0.21, $0.20, $0.19

XRP/USD has found itself caught within a consolidation phase throughout the past few days as it trades just around $0.23 to $0.24. Since the falls that occurred early this month. XRP/USD has been struggling heavily to go back above $0.30. A few days ago, the Ripple bulls managed to push the digital asset to touch $0.25 just before another crash towards $0.23.
Will XRP Break Through $0.28 Resistance Level?
Looking at it technically, the Ripple (XRP) is trading sideways below the 9-day and 21-day moving averages and the range is likely to sustain a short term sideways action. Meanwhile, any slightly positive picture coupled with the right trading volume could see the price of Ripple to spike above the critical hurdle at $0.28, $0.29, and $0.30 resistance levels.
Looking at it critically, if the technical indicator RSI (14) moves below 40-level, the coin may likely follow the downtrend and if the $0.22 support fails to hold the selling pressure, the bears may likely drag the coin below the channel when it could hit the critical supports at $0.21, $0.20, and $0.19 respectively.
Against Bitcoin, XRP is still trading on the downside, although the price action has remained intact within the 9-day and 21-day moving averages. If the selling pressure persists, the Ripple price variation may likely create a new low in the coming days.
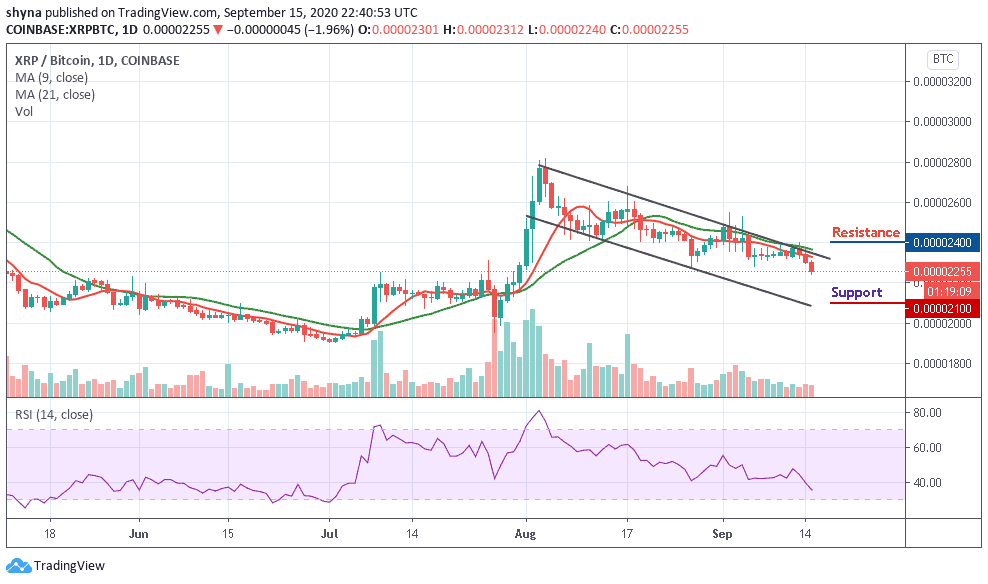
For now, the RSI (14) is seen moving below 40-level; traders may continue to see a negative move in the market as soon as they can expect close support at the 2200 SAT before breaking below the channel to hit the critical support of 2100 SAT and below. If a bullish move occurs and breaks above the moving averages; we may experience a bull-run for the market and the closest resistance levels lie at 2400 SAT and above.
Join Our Telegram channel to stay up to date on breaking news coverage
