Join Our Telegram channel to stay up to date on breaking news coverage
ETH Price Prediction – September 15
As ETH/USD gets ready for the upside, the coin is technically and fundamentally ready for a spike above $400 and $420 respectively.
ETH/USD Market
Key Levels:
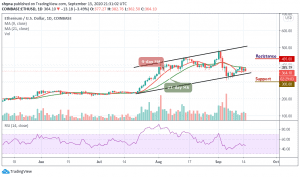
Resistance levels: $435, $455, $475
Support levels: $300, $280, $260

ETH/USD is in consolidation after the price action stalled slightly above $390. According to the daily chart, the seller congestion at $382 could not allow the bulls an easy pass to $400. In light of that, the second-largest cryptocurrency appears to be exploring levels under $370 but again holding above short term support at $360.
What is the Next Possible Direction for Ethereum?
The daily chart illustrates the formation of a symmetrical triangle. ETH/USD is trading in-between the 9-day and 21-day moving averages. Despite the barrier at $390 and the slide under $380, Ethereum can move past the critical hurdle at $400. Meanwhile, if the second-largest cryptocurrency gains exceed $400, there may be a big chance that the uptrend could extend to $420.
For now, a sideways movement between $365 and $385 could be a welcomed move which may likely allow the buyers to forge another attack above the moving averages which could reach the resistance levels of $435, $455, and $475 in the coming positive moves. However, if the price drops below the 9-day moving average, the coin is likely to locate the critical support below the channel at $345 which is a close support level for the bears.
A bearish continuation could bring the market to $300, $280, and $260 support levels as the technical indicator RSI (14) breaks below the 50-level.
Against Bitcoin, the recent price decline has continued to place the coin in a downward trend after witnessing a bullish price action a few days, indicating an undecided market. The price action is still trading below the 9-day and 21-day moving averages. Looking at a long-term bear market, the 3000 SAT and below could provide further support levels for the next selling pressure as the RSI (14) nosedives below 50-level.

However, between yesterday and today, the Ethereum price fell to the 3359 SAT following a sudden rise in the downtrend. Now, we can say that the sellers may likely return to the market after a little indecisive appearance. However, if the 3300 SAT can act as a solid line of defense against any further downtrend; buy pressure at 3800 SAT and above could be visited.
Join Our Telegram channel to stay up to date on breaking news coverage