


Join Our Telegram channel to stay up to date on breaking news coverage
XRP Price Analysis – September 2
Today, Ripple slumped to the previous low after failing to break above the $0.30 price level. The coin fell to a low of $0.26. At the $0.26 support, price corrected upward but faced rejection at $0.28 high. In the case of XRP/BTC, the uptrend faces rejection at level Ƀ0.00002800.
XRP/USD Market
Key Levels:
Resistance Levels: $0.24, $0.26, $0.28
Support Levels: $0.22, $0.20, $0.18
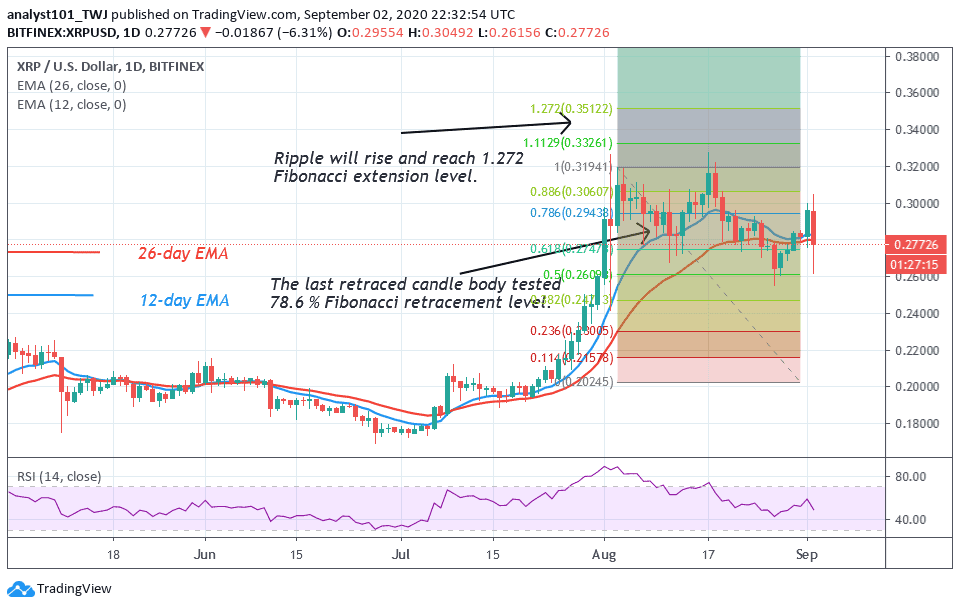
XRP/USD has broken down to $0.26 support after an unsuccessful attempt to break the $0.30 resistance. In the last break down the bulls buy the dips as price rallied to the $0.30 high. Buyers were not able to push price above the minor resistance at $0.30. In today’s breakdown, price is consolidating above $0.27 support. Ripple can only resume the upside range momentum if price breaks above the EMAs or the $0.28 support.
On the downside, if the bears break below $0.26, the crypto will drop to $0.20 support. This will portend negatively for the coin. Meanwhile, the uptrend is intact. According to the Fibonacci tool, XRP has a chance of a further upward move. On August 8, a red candle body tested the 78.6% Fibonacci retracement level. This determines that Ripple will rise and reach 1.272 Fibonacci extension level or $0.26 high.
Ripple (XRP) Indicator Analysis
Ripple is at level 48 of the Relative Strength Index period 14. It indicates that the market is in the downtrend zone and below the centerline 50. The price bars are below the EMAs which indicate that price is in the bearish trend zone. The coin will fall if it faces rejection at the $0.30 resistance.
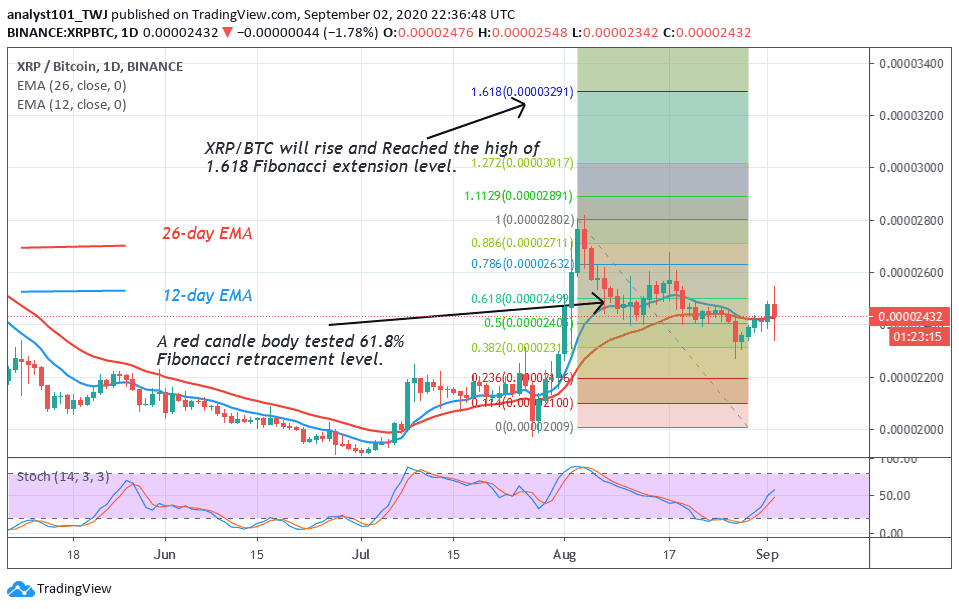
Similarly, on the XRP/BTC chart, the price is in an uptrend. It has broken above the EMAs but faces more selling pressure. In the August 2 uptrend, the bulls were resisted at Ƀ0.00002800. The last retraced candle body tested the 61.8% Fibonacci retracement level. This indicates that XRP/BTC will rise and reach the 1.618 Fibonacci extension level. That is the high of Ƀ0.00003294.
Join Our Telegram channel to stay up to date on breaking news coverage
