Join Our Telegram channel to stay up to date on breaking news coverage
XRP Price Prediction – September 2
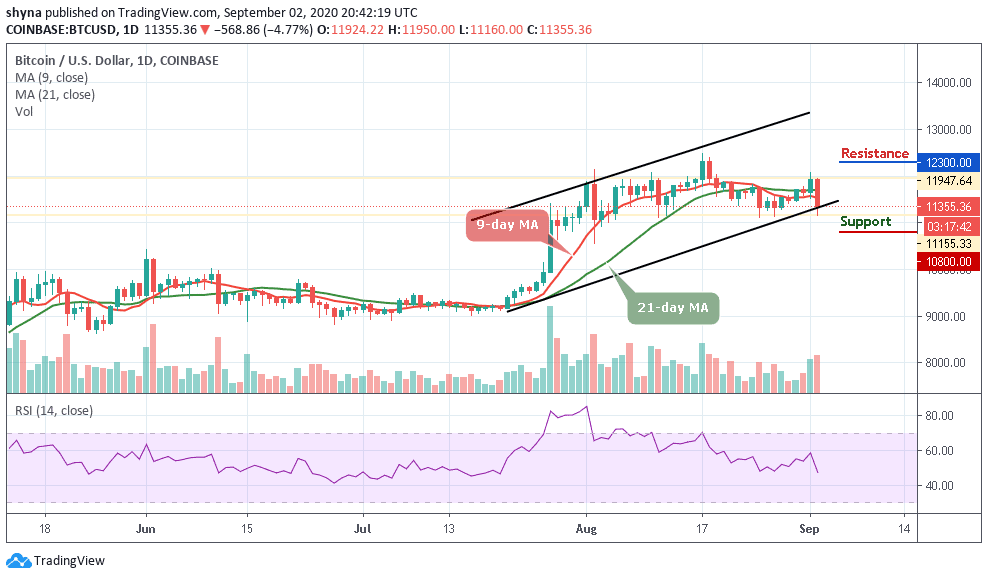
The Ripple (XRP) has failed to hold $0.30 as the price now trades at around $0.27.
XRP/USD Market
Key Levels:
Resistance levels: $0.32, $0.33, $0.34
Support levels: $0.25, $0.24, $0.23

There has been a clear shift in momentum for XRP/USD on the daily chart which is now in a downtrend or at least extremely flat. However, the Ripple Bulls have lost both the 9-day MA and the 21-day MA and they have been rejected from $0.30 again. Traders are seeing a significant increase in trading volume over the past 24 hours due to the overall market weakness while the technical indicator MACD remains within the negative side.
What Is the Next Direction for Ripple (XRP)?
For now, Ripple is facing a reversal as selling activities mount, intensely pressing down on the resistance turned support at $0.27. The retracement level, marginally above $0.27 happened to be a resistance zone in the past few days. Meanwhile, if the Ripple (XRP) holds above this level, there is a chance a bounce may occur, pulling the price above $0.30 again.
Presently, the technical picture is seen turning bearish as shown by the technical indicator as the extended losses below $0.27 could retest the support at $0.26. A formidable bounce is expected at the support level of $0.26, if not, the critical supports at $0.25, $0.24, and $0.23 may be visited. However, on the upside, gains above $0.30 must be followed by higher trading volume to sustain action towards $0.32, $0.33, and $0.34 resistance levels.
Against Bitcoin, the Ripple continues to fall and all the support at the 2500 SAT has broken down. The price is set to test 2600 SAT if Bitcoin’s gain continues to impact the Ripple price. Meanwhile, the bearish scenario remained dominant within the 9-day and 21-day moving averages as the sellers continued to put pressure on the market.
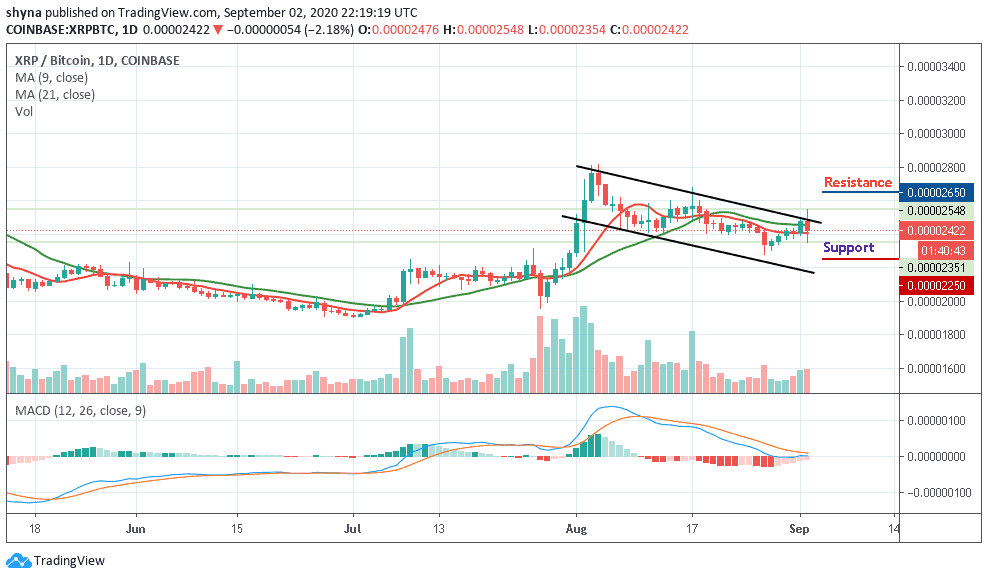
Nevertheless, if the sellers occupy their positions, XRP/BTC may drop to the support level of 2250 SAT and below. At present, the market remains within the negative side of the channel, this could give the bulls another chance to push the coin above the channel. Any further bullish movement may likely hit the resistance levels at $2650 and above.
Join Our Telegram channel to stay up to date on breaking news coverage