Join Our Telegram channel to stay up to date on breaking news coverage
XRP Price Analysis – December 24, 2020
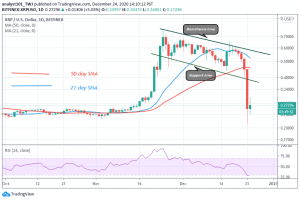
The crypto’s price broke the SMAs as the coin plunged to $0.21 low and pulled back. XRP/USD is in a deep correction, trading in the bearish trending zone. Ripple has found support above $0.24. If the bears break this support, XRP will decline again to $0.20 or $0.17. The XRP/BTC is in a downward move. There is a possibility of a further downward move to level Ƀ0.000009500.
XRP/USD Market
Key Levels:
Resistance Levels: $0.78, $0.80, $0.82
Support Levels: $0.28, $0.26, $0.24

On December 17, buyers failed to push XRP above $0.60 as they suffered a bearish reaction. Ripple plunged to $0.21 low and pulled back. The crypto’s price broke the support line of the descending channel signaling the resumption of the downtrend. XRP has fallen to the 21-day SMA and 50-day SMA which suggests that the coin is in the bearish trend zone. Alternatively, if the 50-day SMA support holds, there is a likelihood of uptrend resumption. The coin is holding above the $0.24 support for a possible upward move.
Ripple (XRP) Indicator Analysis
The bears have succeeded in breaking below the SMAs which signals the resumption of the downtrend. The support line of the descending channel is broken which suggests a downward movement of the coin. XRP has fallen to level 32 of the Relative Strength index period 14. It indicates that the coin is in the downtrend zone below the centerline 50.
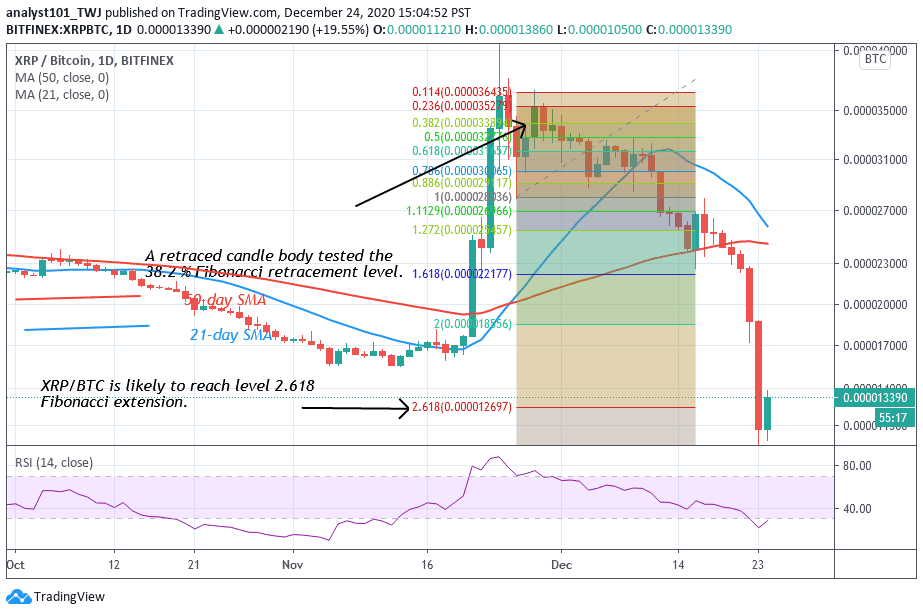
In the case of XRP/BTC, the crypto is in a downtrend. A Fibonacci tool is used to determine The extent of the downward move. Meanwhile, on November 15 downtrend; a retraced candle body tested the 38.2% Fibonacci retracement level. The retracement indicates that the coin will fall and reach level 2.618 Fibonacci extension or the low of Ƀ0.000012697. From the price action, the coin is holding above Ƀ0.000009500 which will signal the resumption of an upward move.
Join Our Telegram channel to stay up to date on breaking news coverage