Join Our Telegram channel to stay up to date on breaking news coverage
Bitcoin (BTC) Price Prediction – December 24
For the past few months, Bitcoin has seen a massive increase in buying pressure after the initial global crash in March 2020.
BTC/USD Long-term Trend: Bullish (Monthly Chart)
Key levels:
Resistance Levels: $28,800, $30,000, $30,200
Support Levels: $14,700, $14,500, $14,300
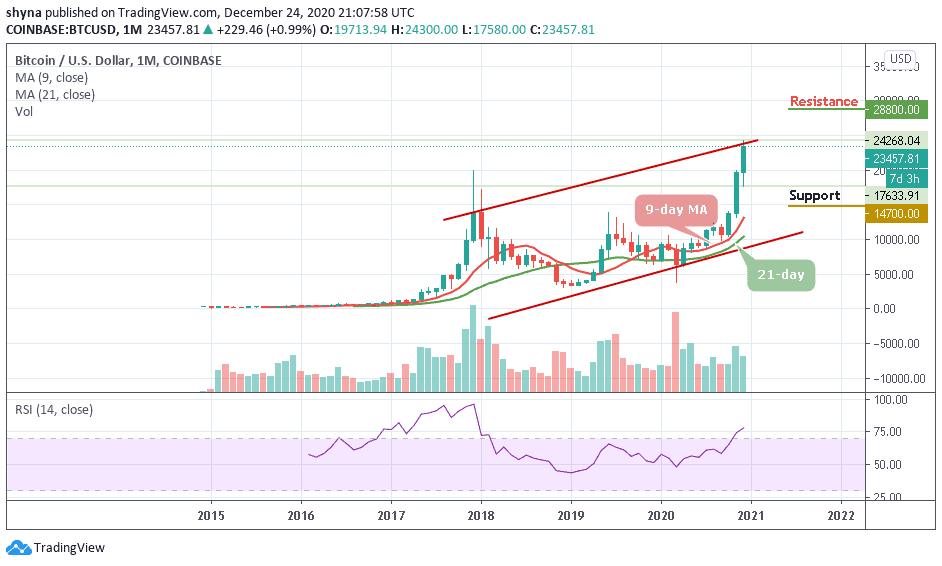
According to the monthly chart, after BTC/USD successfully breaks the $20,000 resistance level for the first time ever, the coin stands in the ‘price discovery’ mode as it faces potential resistance and moves to the upside. Meanwhile, Bitcoin (BTC) has not been able to establish any level above $25,000, this may likely be visited if the market price remains above the 9-day and 21-day moving averages.
Where is BTC Price Going Next?
Looking at the technical indicator RSI (14) in the monthly chart, BTC/USD is not yet done with the upside. Despite touching the monthly low of $17,580, the RSI (14) stays within the overbought region. This means that there is still room that could be explored by the bulls. Moreover, the monthly chart reveals that the king coin maintains the upside as the market price remains above the 9-day and 21-day moving averages.
However, should the price close above the $24,000 resistance level at the end of 2020, BTC/USD may likely experience an extended recovery towards the resistance of $28,000, $28,200, and $28,600 levels in 2021. At the moment, an increase in selling pressure across the market could force the Bitcoin price towards a painful path at $18,700, $18,500, and $18,300 supports. More so, any further bearish movement could lead the first digital asset to the negative side in the coming year.
BTC/USD Medium-Term Trend: Bullish (Weekly Chart)
Looking at the weekly chart, the Bitcoin bulls have not been able to push the market price above the upper boundary of the channel. BTC/USD has survived the $22,000 support as the market resumes upside momentum. The king coin is likely to return to the bull market if the price breaks above the channel. Higher resistance is located at $28,000 and above.
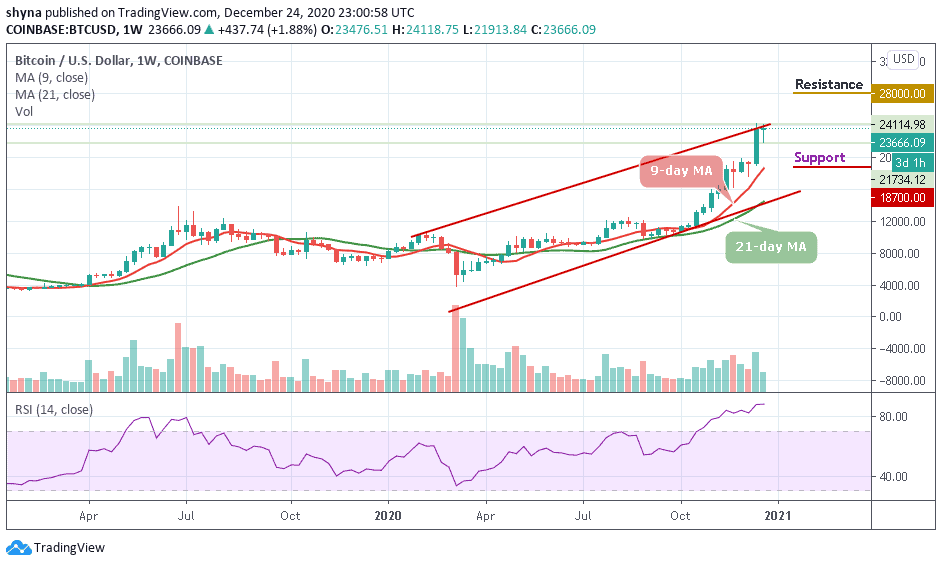
However, if the bearish caves in, even $20,500 may not be able to hold the support. More so, according to the weekly chart, the technical indicator RSI (14) moves within the overbought region. If the market begins to drop, it may likely fall to $18,700 and below. Therefore, in the coming year 2021, BTC/USD may likely maintain the uptrend in as much as the current market price stays above $24,000.
Join Our Telegram channel to stay up to date on breaking news coverage