Join Our Telegram channel to stay up to date on breaking news coverage
USDCAD Price Analysis – July 04
USDCAD price is moving down towards the demand level of $1.2977 in which it may be its target provided there is no interruption from the Bulls.
USD/CAD Market
Key levels:
Supply levels: $1.3111, $1.3207, $1.3367
Demand levels: $1.2977, $1.2783, $1.2638
USDCAD Long-term trend: Bearish
USDCAD is under the bearish momentum on the long-term outlook. GBPUSD price was above the $1.3111 level last week. The level could not hold the price as the Bears exerted a pressure. The Bears broke down the $1.3111 level on June 27, observed a pullback on July 01 and later continue its bearish trend. The price is heading towards $1.2977 demand level.
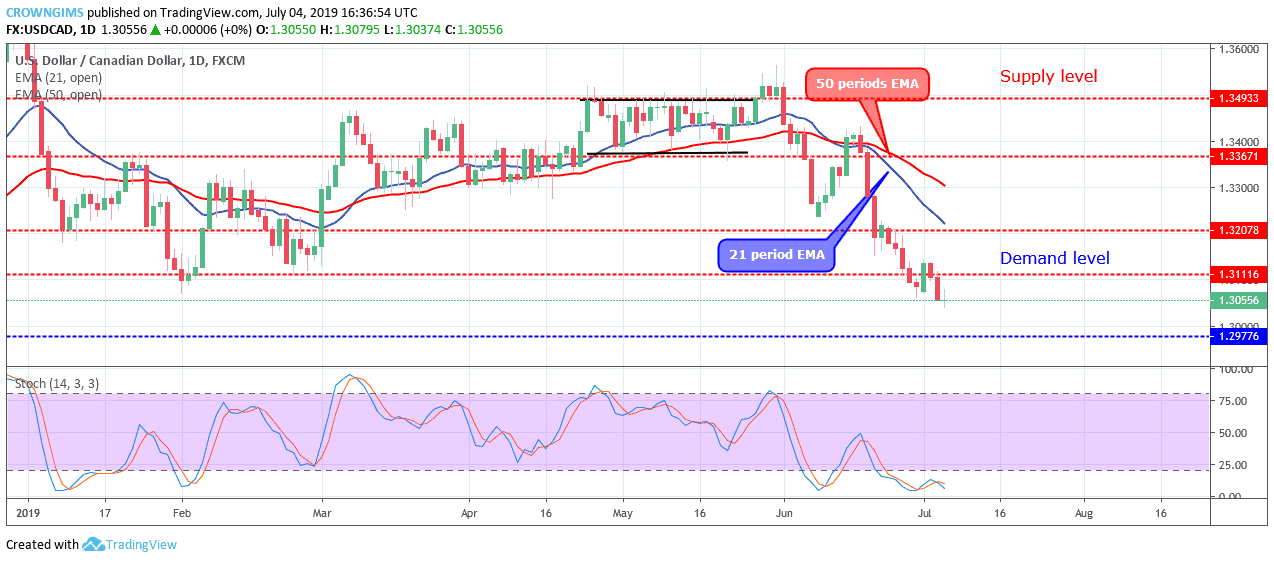
USDCAD price continues its trading below 21 periods EMA and 50 periods EMA at a distance far away from each other as a sign of bearish momentum. The Stochastic Oscillator period 14 is below 20 levels and the signal lines bending down to connotes further reduction in USDCAD price.
USDCAD price is moving down towards the demand level of $1.2977 in which it may be its target provided there is no interruption from the Bulls.
USDCAD medium-term Trend: Bearish
USDCAD is bearish in the medium-term outlook. The bears’ momentum is persistent in the 4- hour chart and the price is moving down steadily with little or no interruption from the Bulls. On July 01, the price pulled back above the 21 periods EMA and the $1.3126 level but the Bulls could not retain the pressure. The Bears took over the market again and the price is descending towards $1.2977 price level.
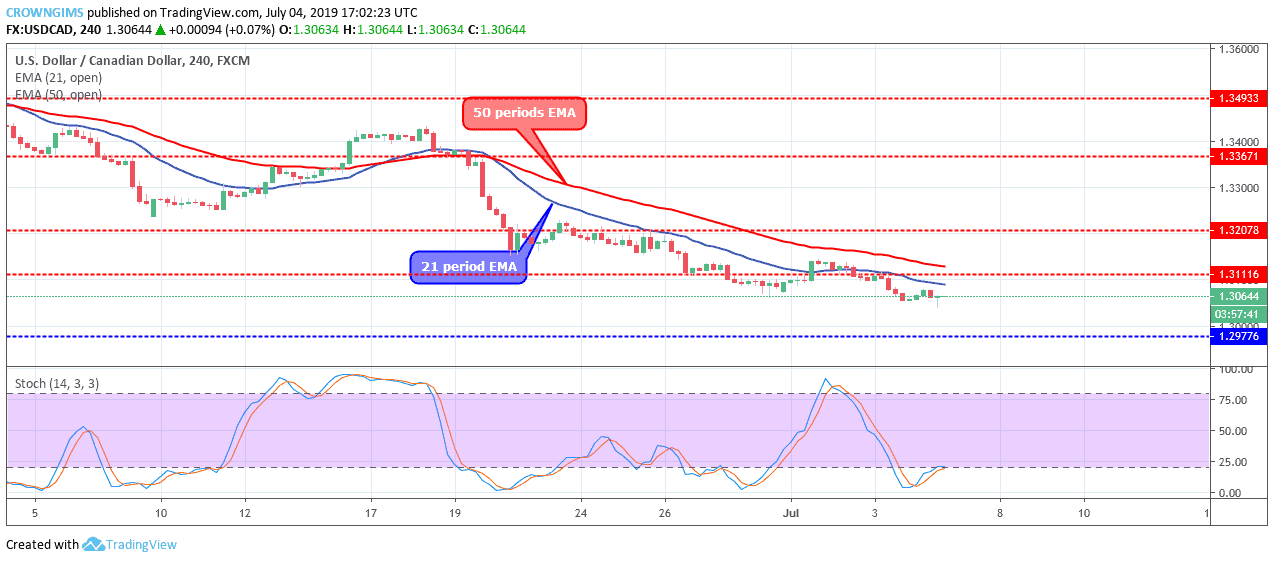
USDCAD is still under 21 periods EMA and 50 periods EMA with close contact with each other as a sign of a decrease in bullish momentum. The Stochastic Oscillator period 14 is at 25 levels and the signal lines bending down to indicate a sell signal.
Please note: insidebitcoins.com is not a financial advisor. Do your own research before investing your funds in any financial asset or presented product or event. We are not responsible for your investing results.
Read more:
- Ethereum Price Prediction: ETH/USD Makes A Quick Retreat; Can Price Maintain $1050 Support?
- Bitcoin Cash Price Prediction – BCH/USD Price Sees Recovery Above $245
Join Our Telegram channel to stay up to date on breaking news coverage