


Join Our Telegram channel to stay up to date on breaking news coverage
ETH Price Prediction – January 15
The Ethereum price is currently retreating as the coin journey towards the $1400 resistance level halted.
ETH/USD Market
Key Levels:
Resistance levels: $1400, $1500, $1600
Support levels: $1000, $900, $800
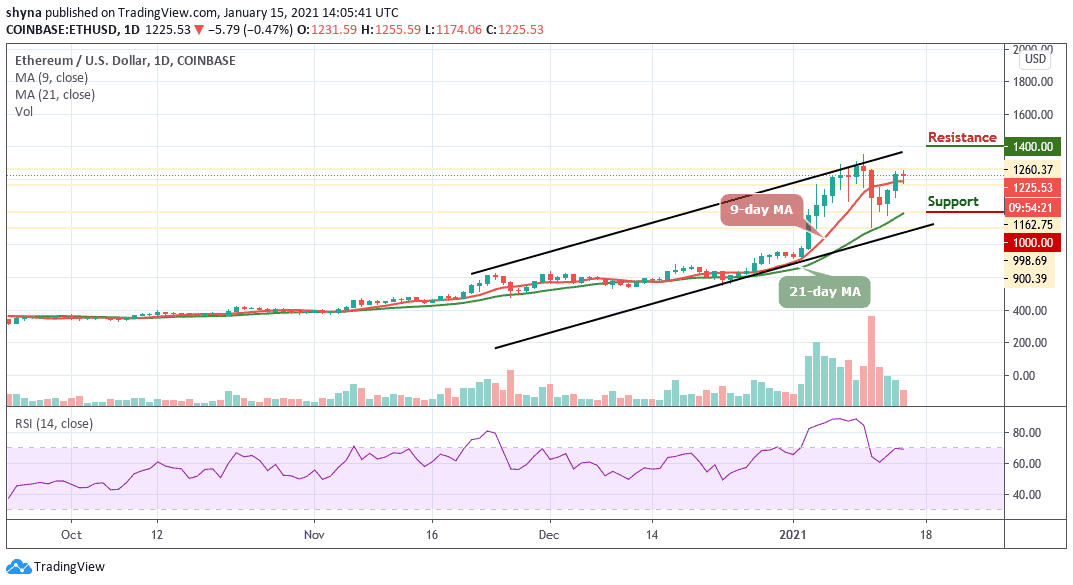
ETH/USD is hovering at $1225.53 following a 0.47 % loss on the day. However, the whole market is currently trading in the red, with most cryptos having succumbed to downward pressure. At the opening of the market today, the daily chart shows that the price first went up to $1255, where it met resistance and later fell to the $1174 support level where it began to correct itself.
What to Expect from Ethereum (ETH)
If the sellers push the Ethereum below the 9-day moving average, the next support levels may be located at $1050. This is followed by significant support towards the lower boundary of the channel and a downside may come into focus. Therefore, if the $1030 breaks, further support may be located at $1000, $900, and 800 levels.
Meanwhile, the RSI (14) is moving beneath the 70-level, if it continues to fall, the increased bearish pressure could drive the Ethereum price towards the lower boundary of the channel. However, the signal line may drop more and looks primed for another bearish crossover signal. The resistance levels are located at $1400, $1500, and $1600.
When compares with Bitcoin, the Ethereum price is range-bound as the coin trades above the 9-day and 21-day moving averages. More so, the sellers are likely to pose an additional threat which may cause the buyers to reach the support level of 0.030 BTC should it cross below the 9-day MA. However, an eventual break below the moving averages of the channel may cause Ethereum to hit the support levels of 0.028 BTC and below.

Moreover, the daily chart reveals that the buyers may continue to push the market above the moving averages to reach the potential resistance at 0.035 BTC and above. The technical indicator RSI (14) is moving to cross above the 60-level, indicating that the bulls are coming up.
Join Our Telegram channel to stay up to date on breaking news coverage
