Join Our Telegram channel to stay up to date on breaking news coverage
USDCAD Price Analysis – July 18
Further pressure by the Bears to break down the demand level of $1.3058 will decline the price to $1.3058 – $1.2930.
USD/CAD Market
Key levels:
Supply levels: $1.3207, $1.3367, $1.3493
Demand levels: $1.3058, $1.2930, $1.2783
USDCAD Long-term Trend: Ranging
USDCAD is ranging in the long-term outlook. The sideways movement continues in the USDCAD market. The momentum of the Bulls and that of the Bears are at equilibrium; that is the Bulls have low momentum and could not drive the price up, likewise, the pressure of the Bears is weak and was unable to push down the currency pair and that is the reason why consolidation of the price lingers on 4-hour chart.
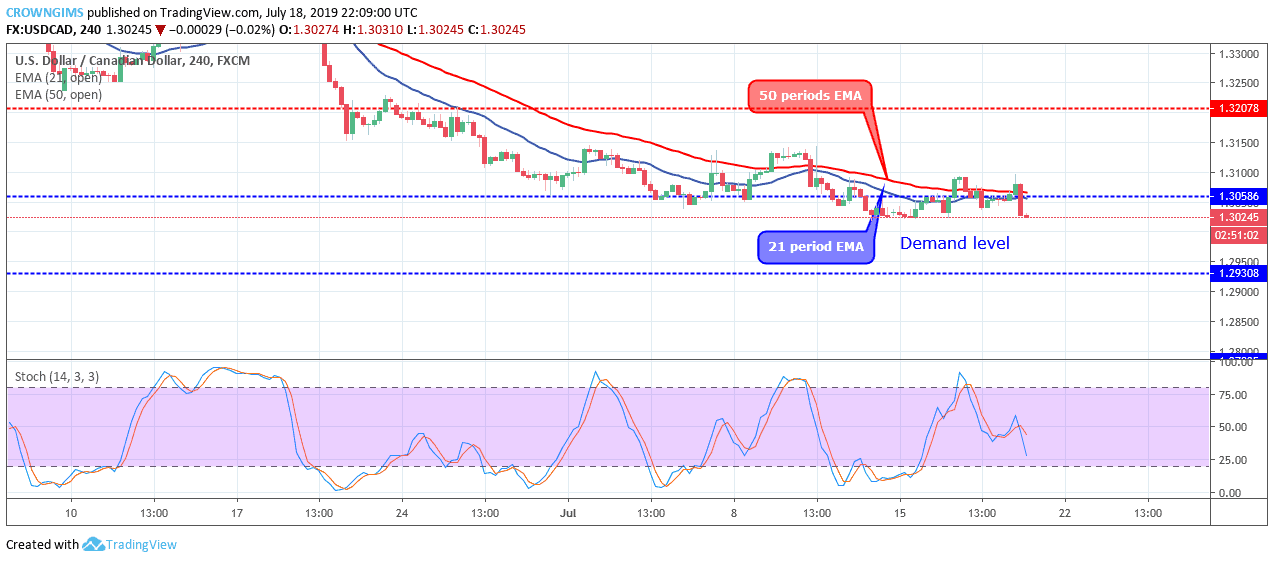
As at the moment, the pair is trading over and around the 21 periods EMA and 50 periods EMA, the two EMAs are in close contact to each other which connotes that consolidation is ongoing in the USDCAD market. However, the Stochastic Oscillator period 14 is at 30 levels and the signal lines pointing down to indicate sell signal.
Further pressure by the Bears to break down the demand level of $1.3058 will decline the price to $1.3058 – $1.2930.
USDCAD medium-term Trend: Bearish
USDCAD is bearish in the medium-term outlook. A “Double top” pattern is formed on the USDCAD 1-hour chart; this indicates that the Bears are taking over the USDCAD market. That is the reason why we have bearish momentum that broke down the $1.3058 price level and the price is decreasing towards $1.2930 price level.
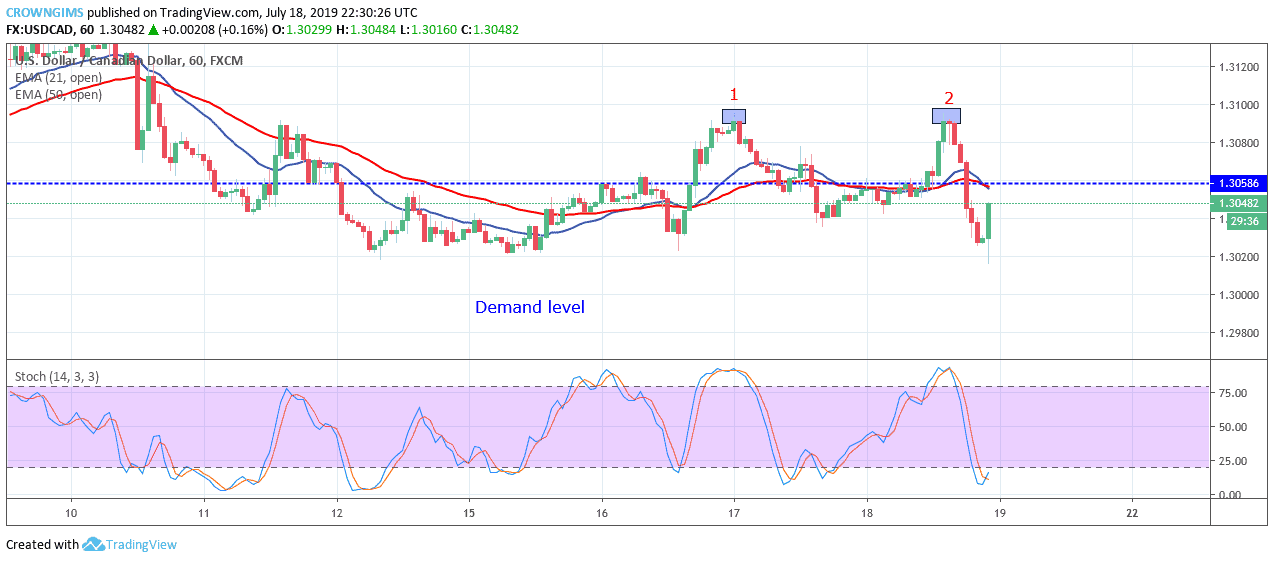
USDCAD is trading below the 21 periods EMA and 50 periods EMA on the 1-hour chart. The Stochastic Oscillator period 14 is at 20 levels and the signal lines bending up to indicate a buy signal.
Please note: insidebitcoins.com is not a financial advisor. Do your own research before investing your funds in any financial asset or presented product or event. We are not responsible for your investing results.
Join Our Telegram channel to stay up to date on breaking news coverage