Join Our Telegram channel to stay up to date on breaking news coverage
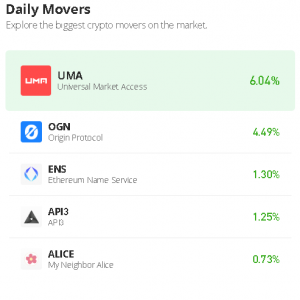
The Universal Market Access price prediction shows that UMA touches the resistance level of $3.0 today as the coin prepares for the upside.
UMA Prediction Statistics Data:
- UMA price now – $2. 6
- UMA market cap – $179.7 million
- UMA circulating supply – 67.1 million
- UMA total supply – 107.7 million
- UMA Coinmarketcap ranking – #135
UMA/USD Market
Key Levels:
Resistance levels: $5.0, $5.2, $5.4
Support levels: $1.05, $1.03, $1.01
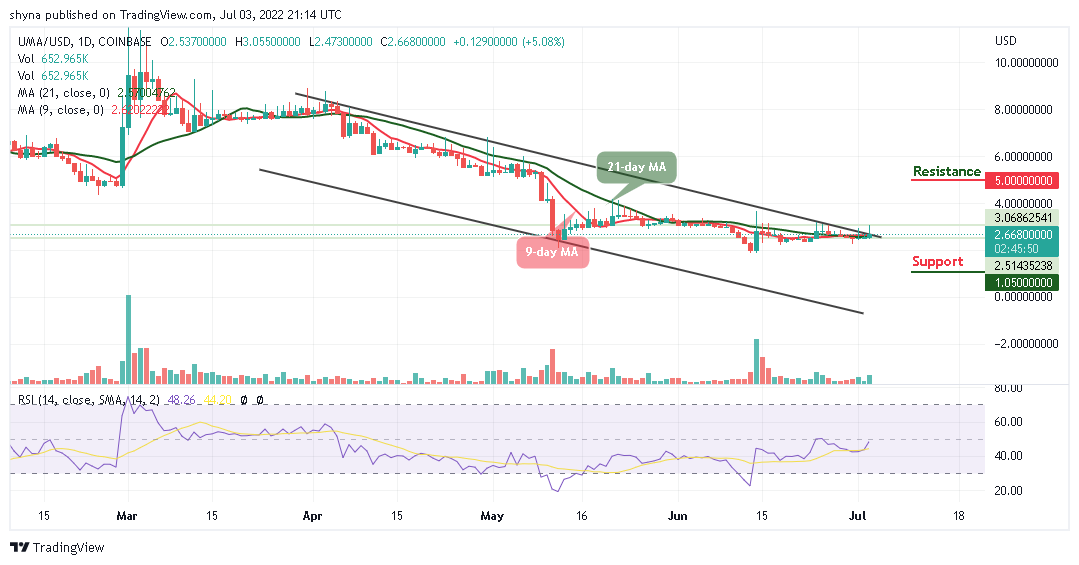
UMA/USD is moving sideways as the coin prepares to embark on the bullish movement. At the time of writing, the Universal Market Access is hovering within the 9-day and 21-day moving averages, and the trend has a bullish inclination, which may likely revisit the previous resistance level of $3.0.
Universal Market Access Price Prediction: UMA May Spike
At the time of writing, the UMA price is likely to cross above the upper boundary of the channel. However, the best bulls can do is to defend the support at $2.4 and focus on pulling towards $3.0. However, if buying pressure increases, the price may break above the channel, and could reach the resistance at $4.0.
Meanwhile, if the coin moves into the positive side, a bullish continuation may cause the coin to hit the resistance levels of $5.0, $5.2, and $5.4 respectively. On the contrary, if the coin slides toward the lower boundary of the channel, a minimum swing could bring the price to a $2.3 level. Exceeding this level could take the bears to $1.05, $1.03, and $1.01 support levels.
Against Bitcoin, the daily chart reveals that the bulls may continue to push the price towards the north. The most recent positive sign suggests that the trend could break above the upper boundary of the channel.
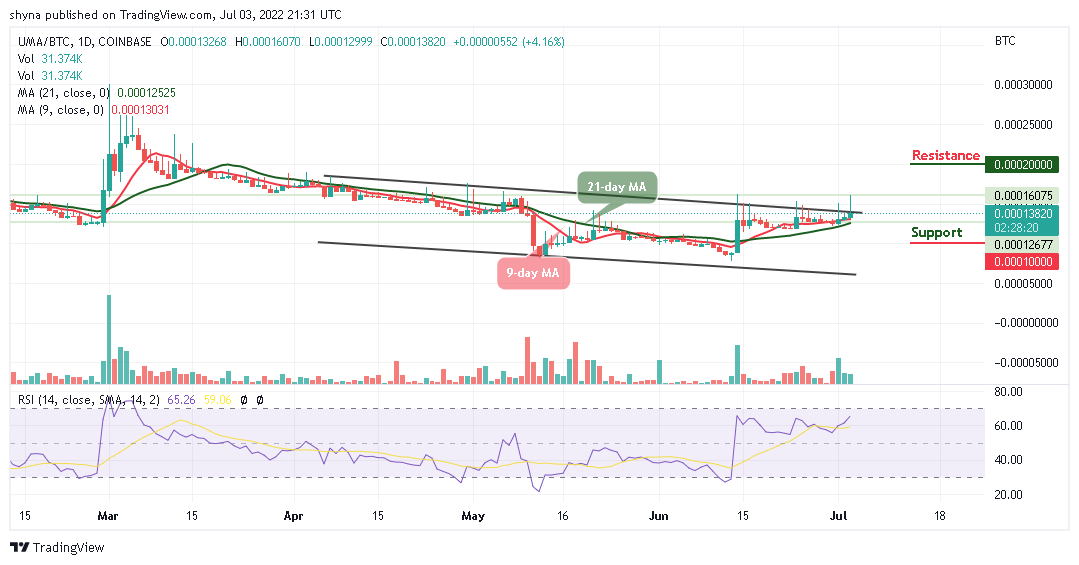
However, as the technical indicator Relative Strength Index (14) moves to cross above the 70-level, it may likely head to the upside, and a bullish continuation could push the price to hit the resistance level of 2000 SAT and above, but once it crosses below the 9-day and 21-day moving averages, the market price may likely begin a downward trend which could bring the coin towards the support level of 1000 SAT and below.
Read more:
Join Our Telegram channel to stay up to date on breaking news coverage