Join Our Telegram channel to stay up to date on breaking news coverage
The Cardano price prediction reveals that ADA may begin to form higher as the coin prepares for the upside.
Cardano Statistics Data:
- Cardano price now – $0.45
- Cardano market cap – $15.4 billion
- Cardano circulating supply – 33.7 million
- Cardano total supply – 34.2 billion
- Cardano Coinmarketcap ranking – #8
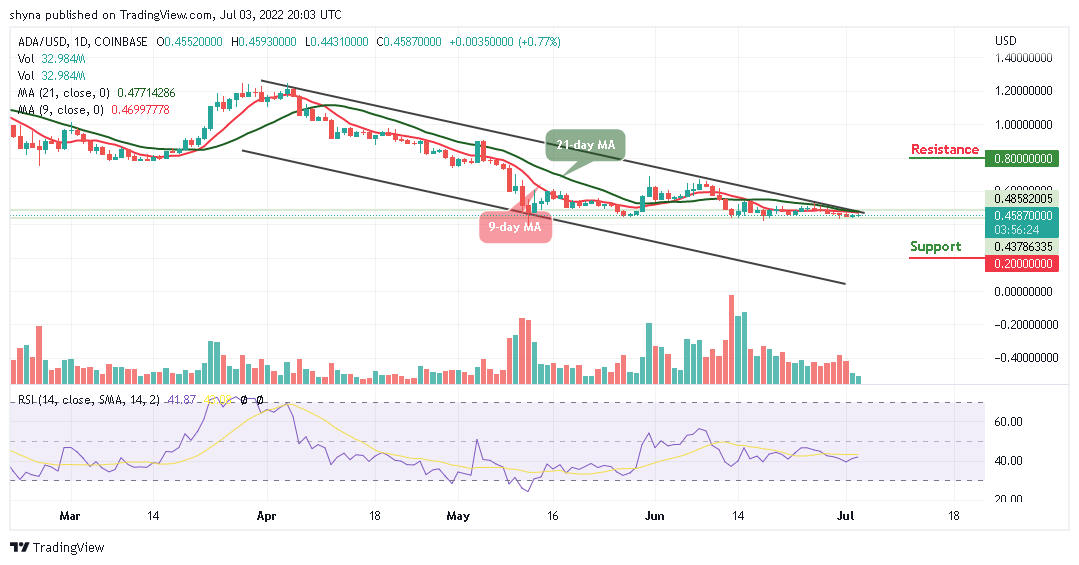
ADA/USD Market
Key Levels:
Resistance levels: $0.80, $0.85, $0.90
Support levels: $0.20, $0.15, $0.10
ADA/USD is attempting to cross above the upper boundary of the channel while the $0.40 level remains the nearest support where the price could hold. However, since a few days ago, ADA/USD has been trading below the 9-day and 21-day moving averages, and this refrains the coin from crossing above the channel.
Cardano Price Prediction: Will Cardano Move Higher?
According to the daily chart, the Cardano price may begin to rise and could probably cross above the channel if the bulls defend the $0.44 support level. Therefore, any bullish movement above the upper boundary of the channel may push the price to the potential resistance levels of $0.80, $0.85, and $0.90.
Nevertheless, this technical analysis may not play out if the coin heads toward the lower boundary of the channel. Therefore, any further bearish movement could reach the support levels of $0.20, $0.15, and $0.10. Moreover, the technical indicator Relative Strength Index (14) is moving above the 40-level, suggesting more bullish signals.
ADA/BTC Market: Cardano Price Keeps Moving Sideways
Against Bitcoin, the Cardano price is hovering above the 9-day and 21-day moving averages. The long-term moving averages may keep the coin on the upside as the market is likely to start a new trend.
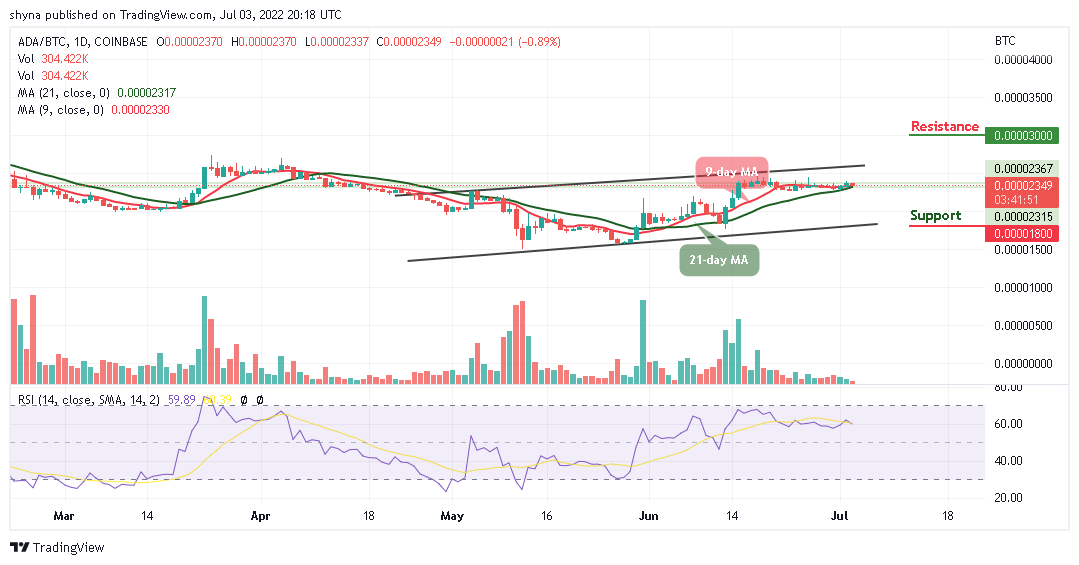
Nevertheless, if the buyers could push the coin above the upper boundary of the channel, higher resistance could be located at 3000 SAT and above as the technical indicator Relative Strength Index (14) stays above 60-level, indicating that buyers are coming to play. Moreover, should the bulls fail to move the current market value above the aforementioned barrier, the bears may increase the selling pressure, and the nearest support level could be located at 1800 SAT and below.
Read more:
Join Our Telegram channel to stay up to date on breaking news coverage