Join Our Telegram channel to stay up to date on breaking news coverage
The Cardano price prediction is seen moving towards the 9-day and 21-day moving averages to hit the $0.50 resistance level.
Cardano Prediction Statistics Data:
- Cardano price now – $0.47
- Cardano market cap – $15.9 billion
- Cardano circulating supply – 33.7.34 billion
- Cardano total supply – 34.2 billion
- Cardano Coinmarketcap ranking – #8
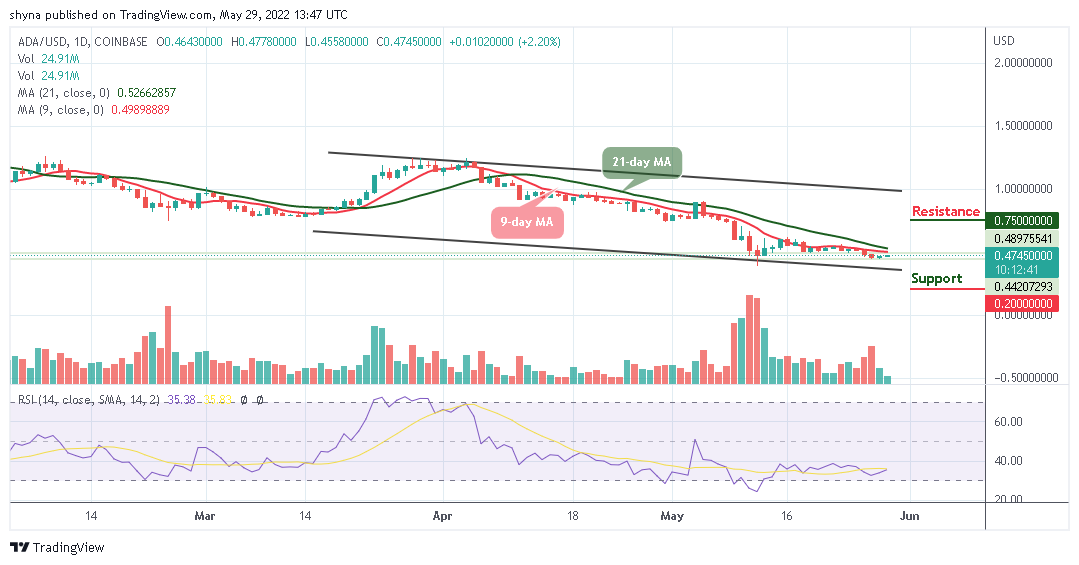
ADA/USD Market
Key Levels:
Resistance levels: $0.75, $0.85, $0.95
Support levels: $0.20, $0.10, $0.05
ADA/USD bulls are trying to push the coin above the 9-day and 21-day moving averages as the technical indicator Relative Strength Index (14) reveals that the market may embark on a positive movement as the signal line moves toward the 40-level.
Cardano Price Prediction: ADA Price May Follow the Uptrend
The Cardano price is changing hands at $0.47 where it faces up. If the coin breaks the $0.50 resistance level, the coin may continue its upward movement to cross above the 9-day and 21-day moving averages. Therefore, the nearest resistance levels are located at $0.75, $0.85, and $0.95, while falling towards the lower boundary of the channel may reach the support levels at $0.20, $0.10, and $0.05 respectively giving a fade bullish trading volume.
ADA/BTC Market: Cardano Price May Consolidate Above the Moving Averages
When compared with Bitcoin, the Cardano price is moving towards the 9-day moving average as the bulls may push the coin to the positive side. On the downside, if the market price fall and drop towards the lower boundary of the channel, the next support level may surface at 1400 SAT to locate further key support at 1300 SAT and below if the sell-off later becomes huge.
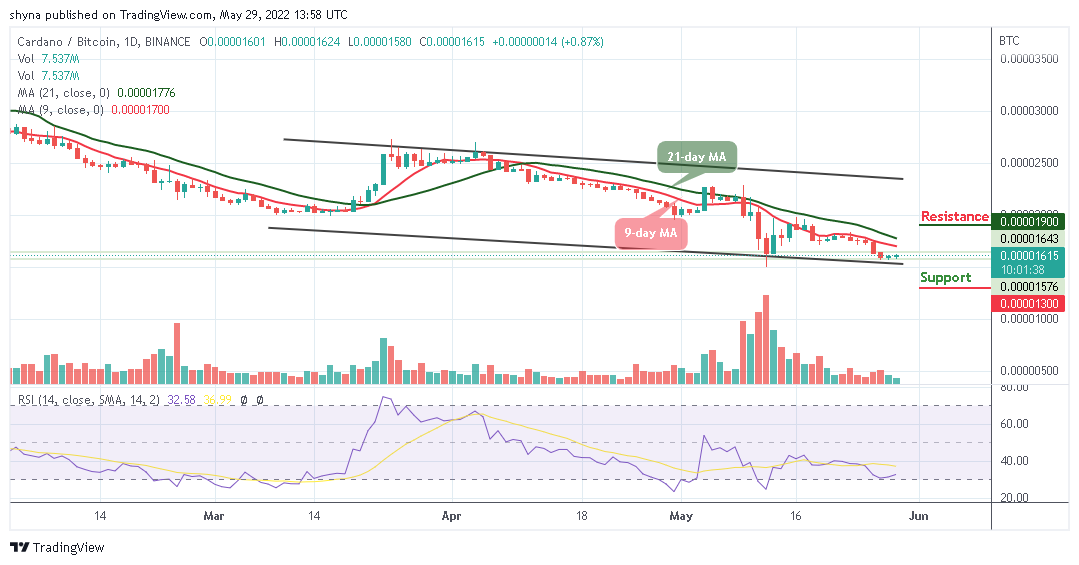
However, on the upside, if the bulls push the price back above the 9-day moving average; Cardano could face the upper boundary of the channel. Further bullish movement may hit the potential resistance level at 1900 SAT and above while the signal line of the Relative Strength Index (14) moves above 30-level to continue the bullish movement. On the other hand, if it moves below this level, it may bring more bearish pressure into the market.
Read more:
Join Our Telegram channel to stay up to date on breaking news coverage