Join Our Telegram channel to stay up to date on breaking news coverage
Tron (TRX) Price Analysis – August 29
TRX has traced a major bearish trend line; for now, its price hovers around $0.15 but yesterday, the coin fails to maintain stability above $0.17.
TRX/USD Market
Key Levels:
Resistance levels: $0.020, $0.022, 0.024
Support levels: $0.012, $0.010, $0.008
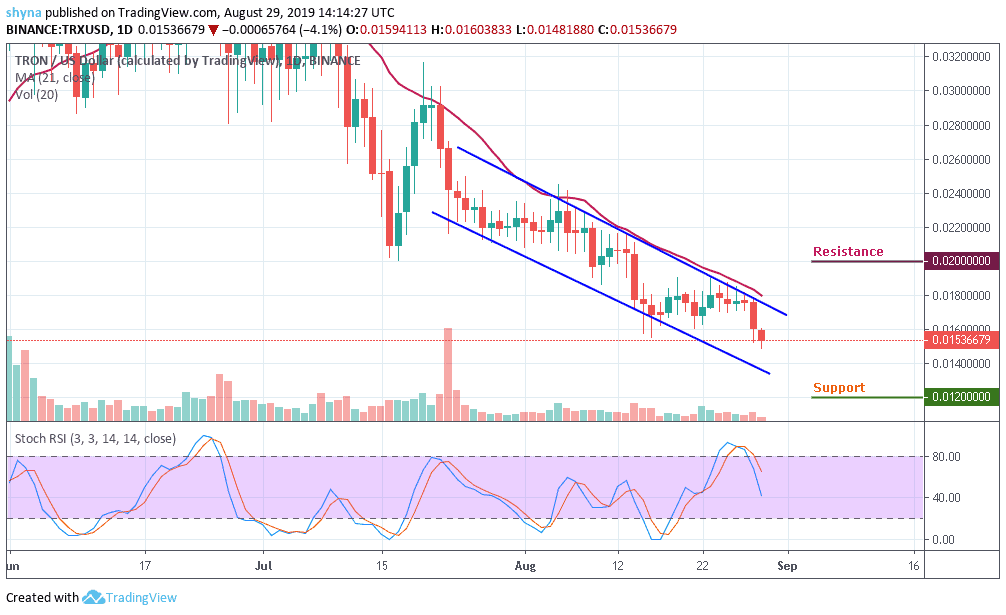
The traders are turning impatient due to the heavy fall in the Tron price. Looking at the chart, we can see that the trading volume is decreasing and the coin moves under 21-day MA. If the TRX/USD pair continues to remain under the control of bear, the price may get to the nearest supports at $0.012, $0.010 and $0.008 levels. It is important to note that the TRX market remains on a short-term downtrend.
Moreover, a bullish control could bring the price back to critical resistance at $0.020. Peradventure the buyers overcome this level, resistances of $0.022 and $0.024 may come into play in the long run. A surge of volatility is looming around the corner. The stochastic RSI faces downward, suggesting a further drop in the price of TRX.
TRX/BTC Market
Against BTC, Tron (TRX) is still trading on the downside, although the price action has remained intact within the symmetric triangle. If selling pressure persists, the TRX price variation may likely create a new low in the coming days. For now, the stochastic RSI has tried to recover from the overbought; we may see a negative move in the market soon.
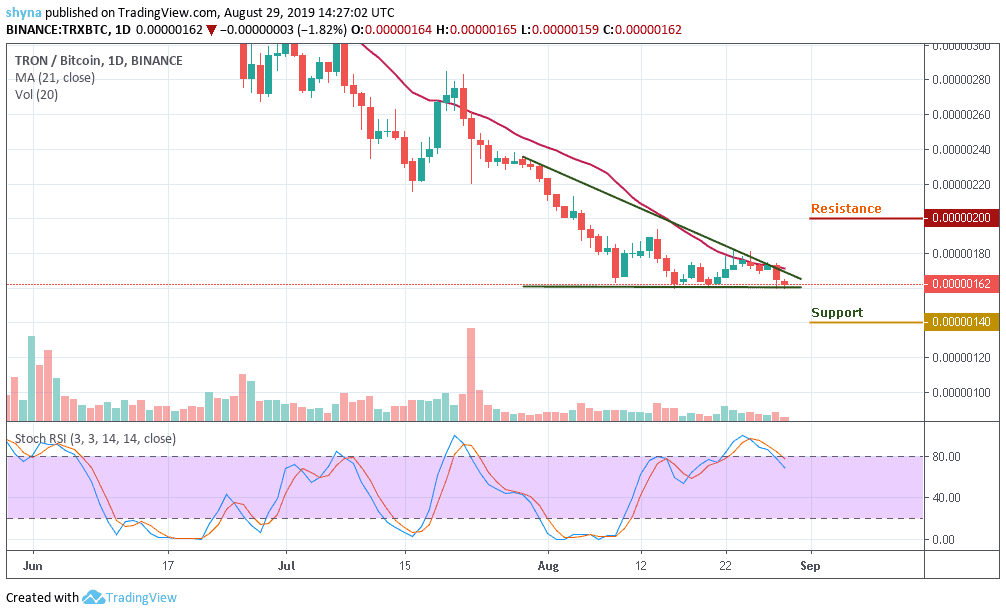
However, the coin is currently trading below the 21-day moving average at 162SAT. We can expect close support at the 140SAT before breaking to 135SAT and potentially 130SAT levels. If a bullish move occurs and validates a break significantly above the symmetric triangle; we can then confirm a bull-run for the market and the closest resistance levels lie at 200SAT, 205SAT, and 210SAT.
Please note: insidebitcoins.com is not a financial advisor. Do your research before investing your funds in any financial asset or presented product or event. We are not responsible for your investing results.
Join Our Telegram channel to stay up to date on breaking news coverage