Join Our Telegram channel to stay up to date on breaking news coverage
THETA price bounced off the 200-day Simple Moving Average (SMA) on Tuesday, rising 12.93% to trade above $1.20. This adds to the gains made by the Theta Network token since the start of the New Year. Bulls were determined to scale the price higher. Let us look at the technical setup that would help investors make an informed decision on whether to buy THETA or not.
THETA Price Trades Above Key Support Levels
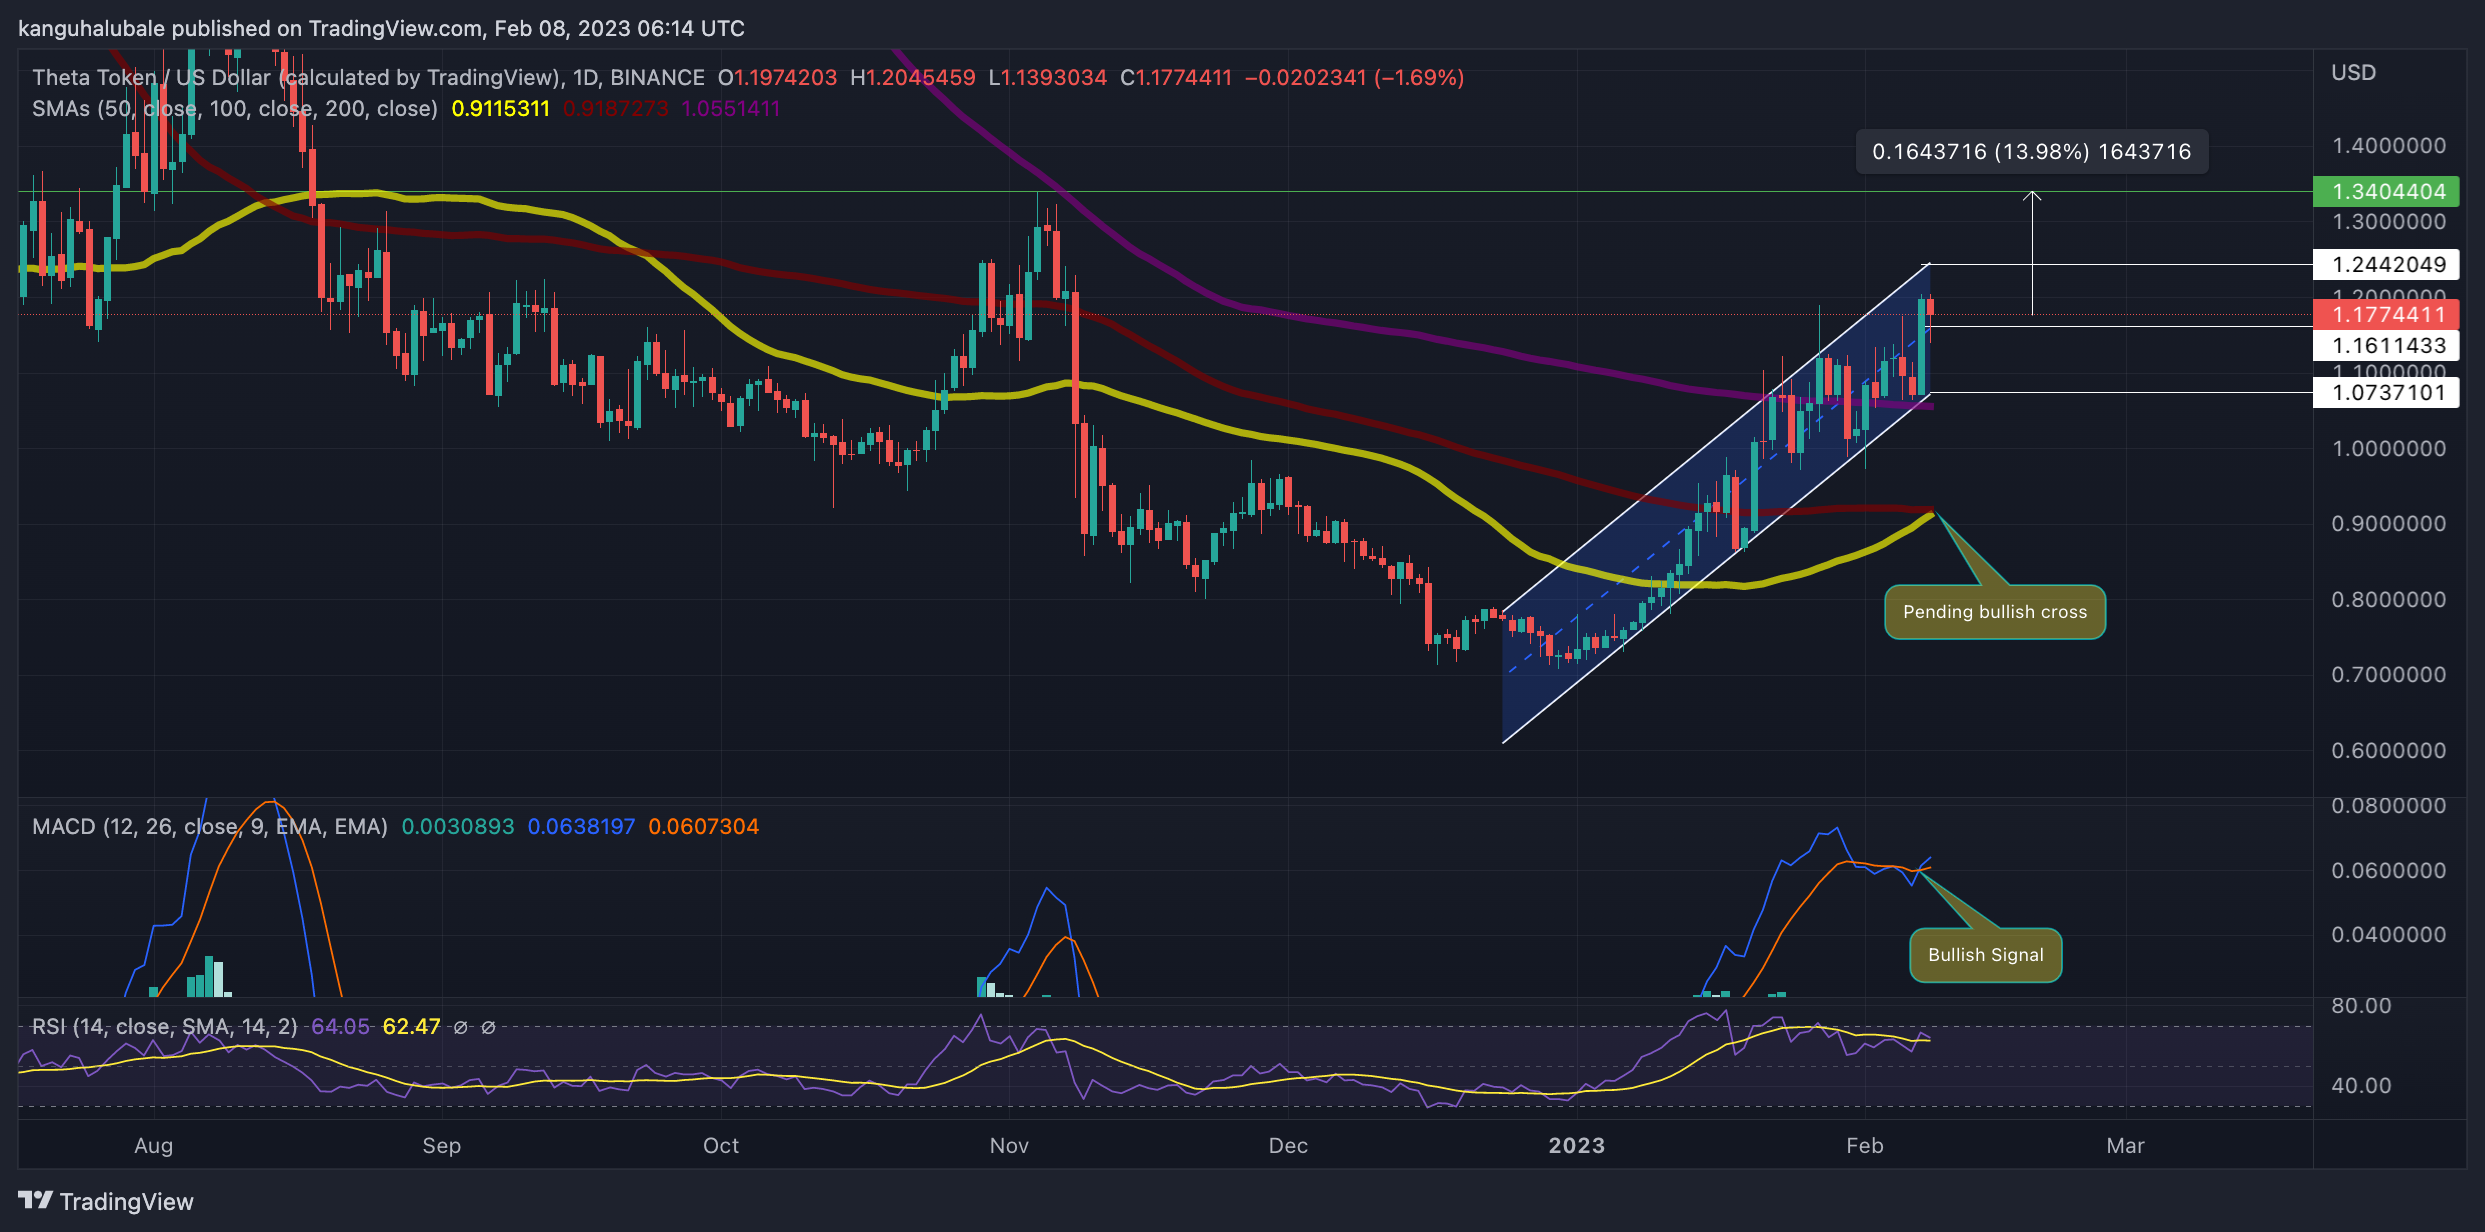
THETA embarked on a recovery at the beginning of last month, rallying 68% to a high of $1.20 on February 7. The price action was defined by a series of higher highs and higher lows leading to the appearance of an ascending parallel channel on the daily time frame (see chart below).
At the time of writing, the price of the Theta Network token was trading at $1.17, up 6% on the day. The bears were focused on undoing yesterday’s gains but the long lower wick on today’s candlestick suggested that the bulls were aggressively defending the immediate provided middle boundary of the channel at $1.16.
The bulls will now attempt to push the price first toward the $1.20 psychological level and later to fight resistance from the upper boundary of the ascending channel at $1.24. If the THETA price manages to rise above this level, it would mean that it has escaped from the confines of the prevailing chart pattern, confirming a bullish breakout. A move to the $1.34 major resistance level would be the next logical move, representing a 14% uptick from the current levels.
THETA/USD Daily Chart

THETA’s positive outlook was validated by the strong support it enjoyed on the downside. These were areas defined by the middle boundary of the rising channel at $1.16, and the lower boundary at $1.07, embraced by the 200-day SMA. Perhaps the most important defense line was the $0.90 psychological level, where both the 50-day And 100-day SMAs appeared to converge.
Technical indicators also supported the bullish thesis for the THETA price. To begin with, the moving averages and the Moving Average Convergence Divergence (MACD) indicator were facing upward. This suggested that the uptrend was strong. In addition, the MACD had just sent a call to buy THETA as shown in the chart above. This occurred during the late American trading hours on Tuesday when the MACD line (blue) crossed above the signal line (orange), indicating a change in market sentiment from bearish to bullish.
Moreover, there was a pending bullish cross from the SMAs. Note that THETA’s uptrend will gain momentum once the 50-day SMA crosses above the 100-day SMA. This may take place in the near-term, suggesting the entry of more buyers into the market.
On the downside, although the Relative Strength Index (RSI) was still positioned in the positive region, it was pointing downwards, away from the overbought region. This showed that bears were entering the market as they booked profits on the rally to $1.20.
As such, the THETA price may turn down from the current price to produce a daily candlestick below the middle boundary of the governing chart pattern. Lower than that, the price may drop to seek solace from the lower boundary of the channel at $0.07, where the 200-day SMA also sat. This could provide a breathing point where buyers may regroup for a while before making another attempt at recovery.
More News
- Open Edition NFTs Are Revitalizing the Market
- Lido DAO Price Explodes 16.5% On Lido V2 Release – Time To Buy LDO?
- How to Buy Cryptocurrencies
Best Wallet - Diversify Your Crypto Portfolio
- Easy to Use, Feature-Driven Crypto Wallet
- Get Early Access to Upcoming Token ICOs
- Multi-Chain, Multi-Wallet, Non-Custodial
- Now On App Store, Google Play
- Stake To Earn Native Token $BEST
- 250,000+ Monthly Active Users
Join Our Telegram channel to stay up to date on breaking news coverage


