

Join Our Telegram channel to stay up to date on breaking news coverage
Terra LUNA price appears to be on the track for a continued downside despite a bullish recovery being witnessed across the crypto market. Bitcoin is up 6.4% in the last 24 hours to trade above the $30,000 mark at $30,105 while Ethereum towers above $2,000 ahead of the Shanghai and Capella upgrades scheduled for Wednesday.
In the face of a 46% decrease in daily trading volume to $43.8 million, LUNA has gained 0.27% on the day to trade at $0.000125 at the time of writing. LUNA and other tokens native to the Terra blockchain have been on a persistent decline for a few weeks now following reports that the Terraform Lab’s founder Do Kwon had been arrested in Montenegro.
Terra Luna’s Price At Risk Of 22% Losses
LUNA has traded within the confines of descending triangle’s trendlines, with the resistance line connecting a series of lower highs and the support line relatively equal lows since March 5 when the token turned down from $0.00015.
Recovery attempts aimed at keeping LUNA from dropping further downstream failed at several levels including $0.00016 and $0.00013. LUNA later settled above a buyer congestion zone highlighted by the triangle’s horizontal line at $0.00012 as shown on the daily chart.
A descending triangle is a highly bearish technical pattern that points to the continuation of a downtrend. It is confirmed once the price breaks below the horizontal trendline (x-axis) projecting a move downward equal to the thickest part of the triangle.
At the time of writing, Terra Luna price was fighting to break out of the bearish triangle while trading at the downtrend line above $0.000125. A daily candlestick close above the said level would see LUNA break out of this triangle with the next barrier being found at the $0.000135 level, embraced by the 50-day Simple Moving Average (SMA).
Overcoming this barrier would propel the bulls to push LUNA above the $0.00014 psychological level before tagging the $0.000148 range high.
LUNA/USD Daily Chart

However, this move to the upside was highly unlikely given the decreasing trading volume. The downfacing moving averages and the movement of the Stochastic RSI away from the overbought region pointed to the lack of strength amongst the buyers to sustain the ongoing recovery.
The position of the Stochastic RSI at 83 showed the Terra Luna price was overbought, suggesting buyer exhaustion and a weakening recovery. As such, the sellers are slowly taking over as profit-taking kicks in.
Moreover, the movement of the Moving Average Convergence Divergence (MACD) indicator below the zero line in the negative region suggested the market still favored the downside.
Furthermore, LUNA price faced stiff resistance on the upside. These were areas defined by the triangle’s descending trendline at $0.0001252, the 50-day SMA at $0.000135, the 100-day SMA at $0.000153 and the $0.00016 psychological level. As such, the path with the least resistance was downward.
Therefore, a daily candlestick close below the triangle’s resistance line at $0.000125 would push LUNA toward the support line at the $0.00012 psychological level. Breaching this support would confirm the pattern, projecting Terra Luna’s downward spiral toward the technical target of the governing chart pattern at $0.0000967. Such a move would represent a 22.7% drop from the current price.
Analysing Terra Luna Price Action On A Shorter Time Frame
LUNA price presents a slightly more bullish outlook on the four-hour timeframe with the technical setup projecting a significant move in the near term. It should be noted that Terra Luna price has formed an ascending triangle chart pattern on the four-hour chart which has the potential to result in a surge of 8.26% above its current market value of $0.000125, reaching highs of approximately $0.000135.
LUNA/USD Four-hour Chart
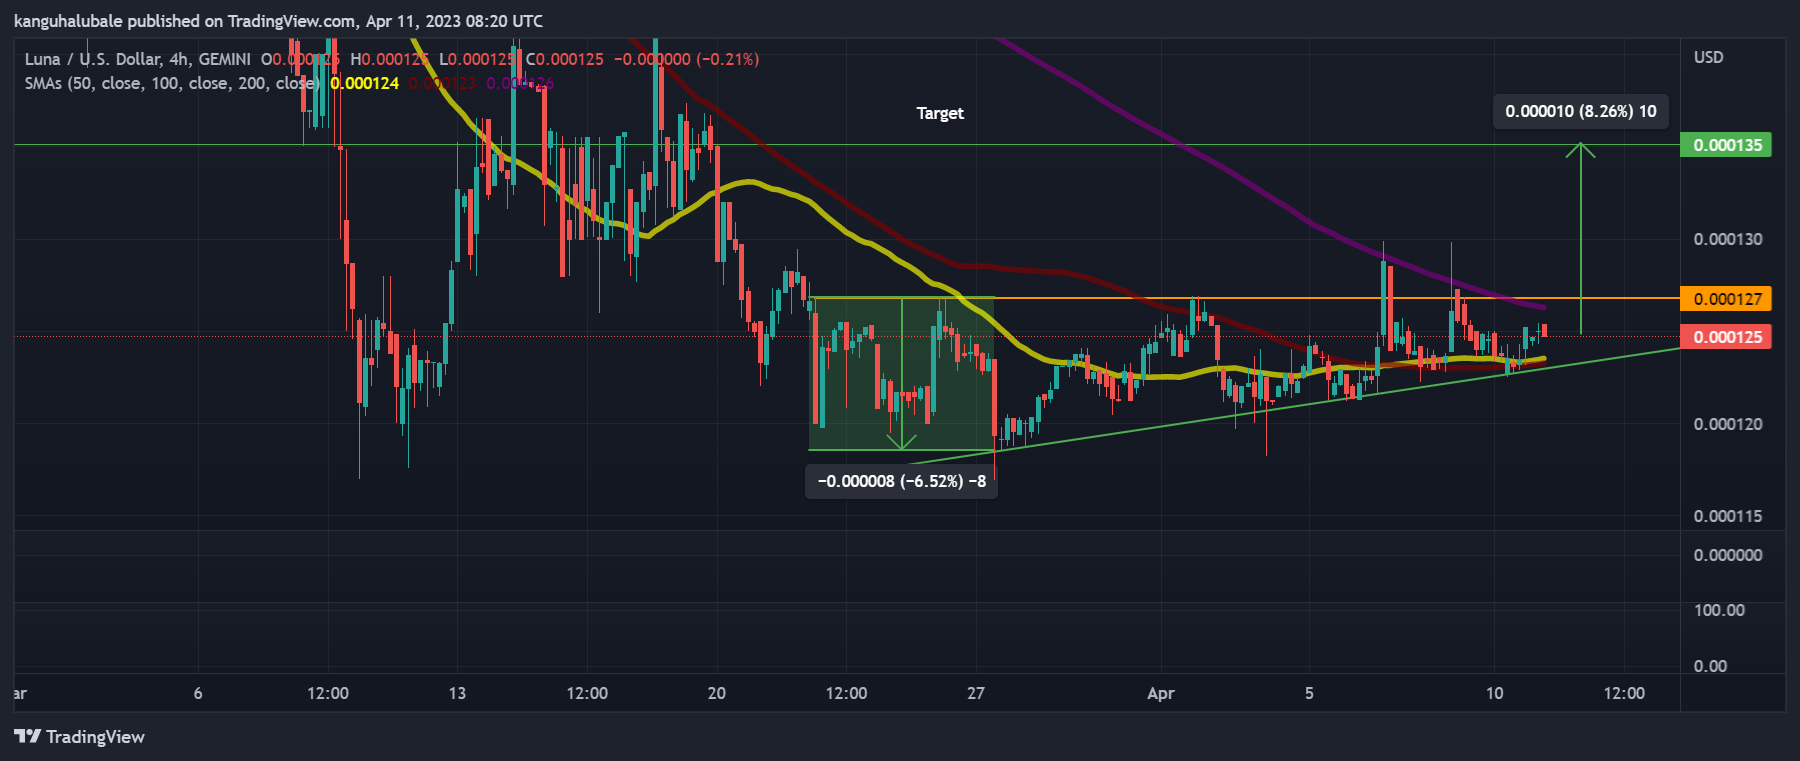
Unlike a descending triangle, an ascending triangle often culminates in a bullish outcome. It appears on the chart as the price consolidates within two trendlines – an ascending trendline connecting a series of higher lowers and a horizontal line connecting relatively equal lows.
When such a pattern forms on the chart, it hints at weakening selling pressure and reducing volatility to the downside, ushering in buyers who would then drive the price upward.
Traders are often encouraged to wait for confirmation before trading this pattern—and this comes into the picture when the price breaks above the horizontal line or the x-axis to suggest that there is a higher probability of a bullish trend reversal.
Despite the bullish technical formation, market participants should be aware of the position of the Terra Luna price relative to the moving averages. On the four-hour chart, LUNA trades below the 200-day moving average (line in purple).
The first batch of put orders may be activated above the immediate resistance at $0.000125, but more specifically above the 200-four-hour SMA at $0.000126. Day traders could start cashing out at the 50-day SMA at $1.35 and the 100-day SMA at $0.000153.
Promising Alternatives To LUNA
Although Terra Luna price appears slightly bullish in the shorter timeframe, its prospects on the longer daily time frame paint a gloomy picture. Given the uncertainty around LUNA, investors may want to consider some of the best altcoins in the market offering a better risk-reward ratio and excellent opportunity to diversify their crypto portfolio. InsideBitcoins team releases a weekly review of the best crypto presales to buy for 2023. The tokens listed here are currently in their presales, which means investors would be buying the tokens at a discounted price.
One of these tokens is METRO, the native token of the Metropoly platform – a novel blockchain project bringing fractional ownership into the real estate industry. Metropoly offers an innovative way of driving investment into the real estate industry, tapping the decentralized power of blockchain technology.

Users on this platform will for the first time be able to invest in real estate properties around the world within a record 20 seconds, drastically cutting the time from the traditional 60 days needed to complete the purchase of any property.
Metropoly is also building the first innovative real estate-based NFT marketplace to bolster investment in income-generating properties around the world, while at the same time, eliminating the need for intermediaries like banks which often introduce hidden fees.
NFT holders can benefit from their ownership by selling their NFTs whenever they want and enjoying the increase in value.
$METRO PRE-SALE ENDS SOON! ⏰
💸 1.2 Million USD raised
👥 3000+ Participants
🌐 Beta is LiveGet passive monthly rental income by investing in real estate worldwide in seconds, not months! 🏠💰
Pre-Sale Link
👉 https://t.co/PrZ9uUYFRW pic.twitter.com/LScwBvyFYk— METROPOLY (@metropoly_io) April 11, 2023
Investors are buying METRO tokens in an ongoing presale that has bagged $1.2million. At stage 12 of the presale, 1 METRO is selling for $0.08 and users are requested to hurry because this is the last chance before the token lists on exchanges for the first time. The exchange listing price is set at $0.1.
Related News:
- Terra’s Luna Price Prediction As $45 Million In Trading Volume Comes In – Can LUNA Swing To $2.4?
- Bitcoin Price Prediction for Today, April 11: BTC Price Hits the Significant $30K Price Level
- Metropoly Presale Crosses $1.2M Milestone, Current Stage Ending in Hours
Join Our Telegram channel to stay up to date on breaking news coverage