
Join Our Telegram channel to stay up to date on breaking news coverage
Terra Classic (LUNC) Price Prediction – June 2
The LUNC/USD market operation has run in a descending trading pattern just since its inception two months ago in crypto-economy transactions. Its all-time high value is at $119.18, and the all-time low is $0.00001675, showing a loss record so far. Price is trading around $0.00009741 at a positive percentage rate of 1.88.
Terra Classic (LUNC) Price Statistics:
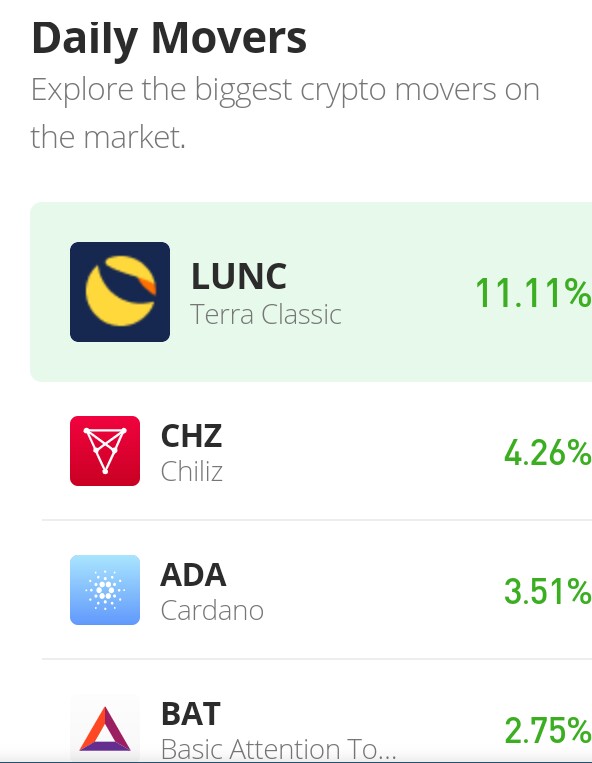
LUNC price now – $0.00009805
LUNC market cap – $638.9 million
LUNC circulating supply – 6.5 trillion
LUNC total supply – 6.9 trillion
Coinmarketcap ranking – #214
LUNC/USD Market
Key Levels:
Resistance levels: $0.00010, $0.000011, $0.000012
Support levels: $0.00009, $0.00008, $0.00007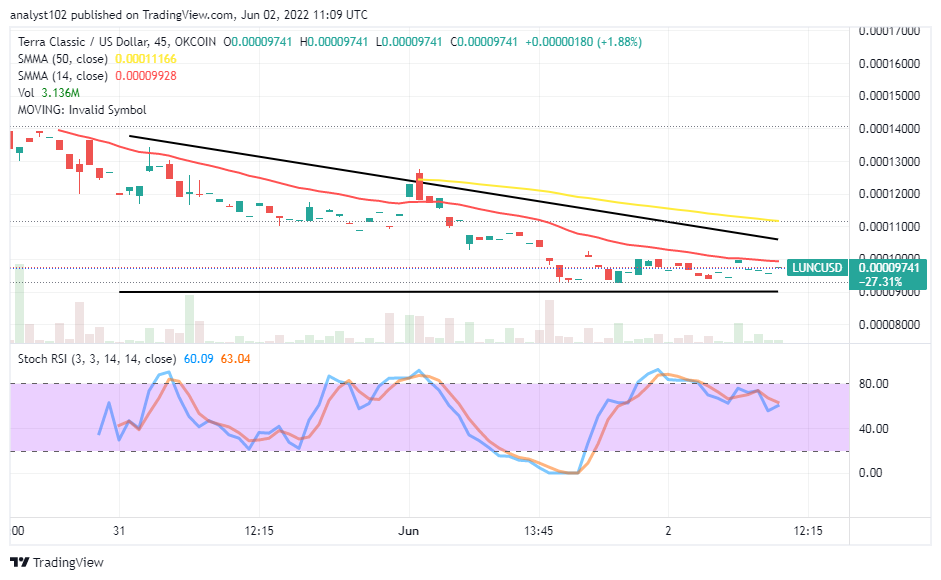 LUNC/USD – Lon-term Chart
The LUNC/USD long-term chart reveals the crypto-economic market run in a descending trading pattern from its higher-trading level of $119.18 to huge significant free fall-offs. The Japanese trading candlesticks are being skeletally appearing based on the pairing trading instruments that have just been introduced freshly on platforms. The part of the 50-day SMA indicator is above the 14-day SMA indicator. The Stochastic Oscillators have slightly bent southbound at the 80 range to denote the crypto encounters a resistant-trading point presently.
Can there be an occurrence of a downing motion in the LUNC/USD trade at the $0.000010 resistance level soon?
For quite a while, the LUNC/USD market operation has been striving to surge past the $0.000010 resistance level but to no avail until the present time as the crypto runs in a descending trading pattern. As a result of that technical thought, long-position takers may have to wait for a while to let the price observe a correction down to reasonable lower trading before considering a buying order afterward. Nevertheless, investors may consider buying into this crypto deal now. And to add more while price tends to go dipper.
On the downside of the technical analysis, a trading barrier line appears to have been in place around the $0.000010 resistant level. Short-position executors have to be vigilant to launch a sell order around the value line not to get caught by the bulls’ trap, while the market also tends to hike fearfully at the point in no time. There can be a slowdown-trading situation between $0.000010 and $0.00009 points in the subsequent sessions.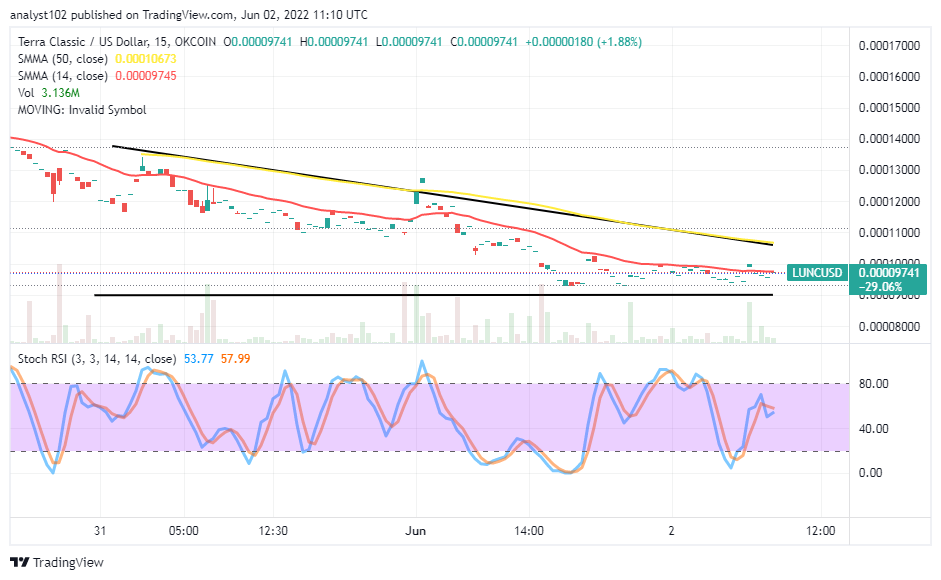
LUNC/USD Medium Chart
On the medium-term analytics scale, the LUNC/USD market runs in a descending trading pattern around the downward trending path of the smaller SMA. The 50-day SMA indicator is above the 14-day SMA indicator. The horizontal line drew at the $0.00009 support level to show it as the critical support baseline where long-position players may be playing safe to launch a buying order. The Stochastic Oscillators have crossed their lines southbound briefly around the 70 range to signify the downward-trending force isn’t over yet to some extent.
Read more:
Join Our Telegram channel to stay up to date on breaking news coverage