
Join Our Telegram channel to stay up to date on breaking news coverage
Terra Classic (LUNC) Price Prediction – August 15
There has been a situation denoting that the LUNC/USD market is trading in wide range-bound spots as the crypto economy may hold energy above the $0.0000882 line. Price has touched a high of $0.00009952 and a low of $0.00009759 at a negative rate of 4.24 percent.
Terra Classic (LUNC) Price Statistics:
LUNC price now – $0.00009675
LUNC market cap – $635.7 million
LUNC circulating supply – 6.6 trillion
LUNC total supply – 6.9 trillion
Coinmarketcap ranking – #213
LUNC/USD Market
Key Levels:
Resistance levels: $0.00011, $0.00012, $0.00013
Support levels: $0.00008, $0.00007, $0.00006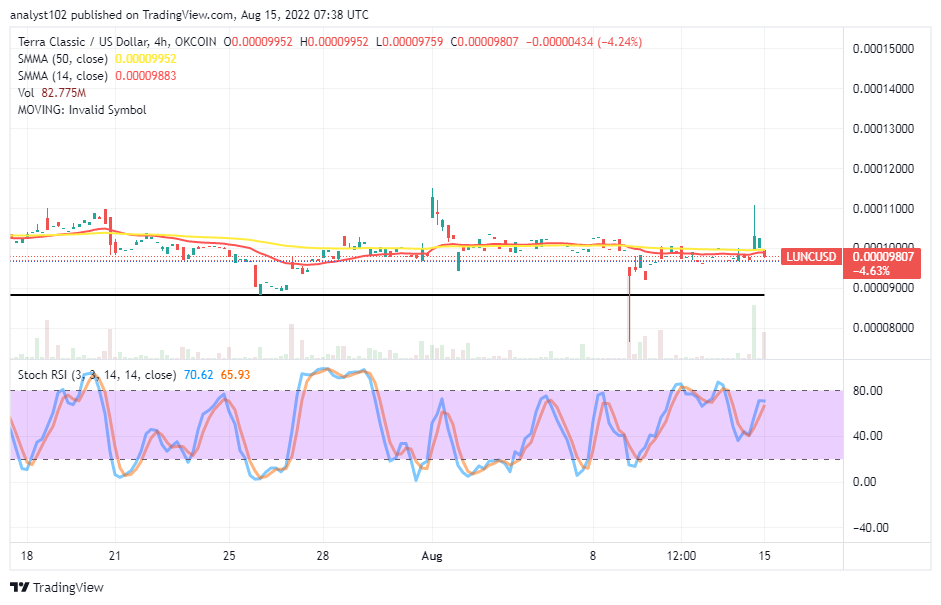 LUNC/USD – Lon-term Chart
The LUNC/USD long-term chart reveals the crypto economy may hold energy above the $0.0000882 support level as it trades around $0.00009807. A horizontal line drew to mark down the former value line as the critical baseline. The 14-day SMA indicator is at $0.00009883 beneath the $0.00009952 value line of the 50-day SMA indicator. The Stochastic Oscillators have stretched northbound to the range points of 65.93 and 70.62, attempting to close the lines. That can potentially lead to a declining motion afterward.
Your capital is at risk.
Will the LUNC/USD market traders take to buying spree at the moment?
From the technical point of reading the view of the Stochastic Oscillators, the LUNC/USD market traders may need to exercise some degree of caution at the moment even though the crypto economy may hold energy above the $0.0000882. It would be safer to await an active pull-down toward the value line and await its completion that can give rise back to an upward movement in the process before long-position placers can have a decent resumption to the upside direction.
On the downside of the technical analysis, it should have expected the LUNC/USD market bears to have launched a selling order at the time of active correctional motion that occurred when the price spiked northward to touch a resistance point at $0.000011. A smaller bearish candlestick surfaces, denoting that a downward move is relatively in process. And that can extend to a lower-trading zone below the trend lines of the SMAs.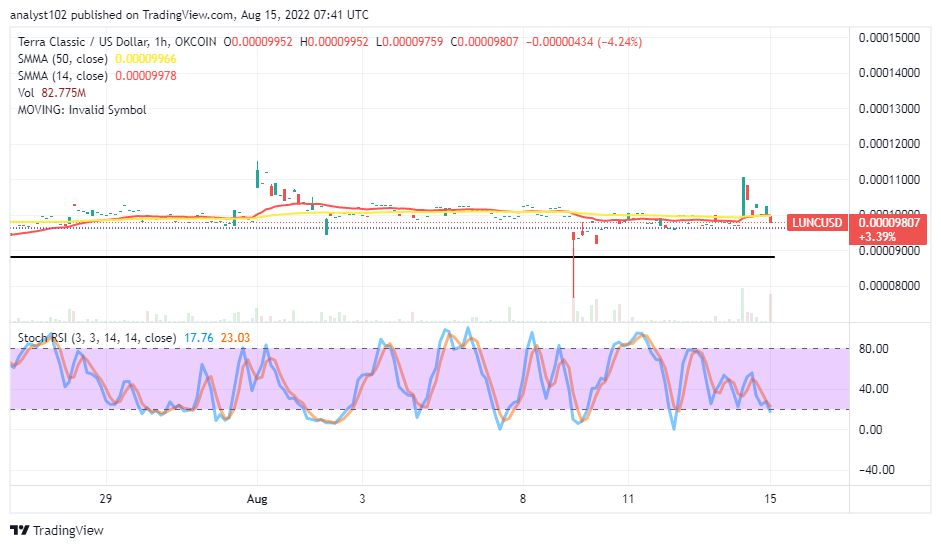
LUNC/USD Medium Chart
The medium-term chart showcases that the LUNC/USD market may hold energy above the $0.0000882 level, and it has been marked by a horizontal line closely over the $0.0000800 support. The 14-day SMA indicator is alongside the 50-day SMA indicator. And they are predominantly seen around the $0.000099 or thereabouts, pointing toward the east. The Stochastic Oscillators have moved southbound to the 23.03 and 17.76 range points. That signifies the market is on the verge of running into a consolidation mode, which may let the crypto valuation down for some time.
Read more:
Join Our Telegram channel to stay up to date on breaking news coverage