Join Our Telegram channel to stay up to date on breaking news coverage
Terra Classic (LUNC) Price Prediction – October 1
On September 26th last trading session, a spike occurred in the LUNC/USD market activities, spanning northwardly, and the crypto currently builds a buying wall through it closely from the top of the $0.0002 support line. The last seven days of operation have produced high and low-value points of $0.0003272 and $0.0001825. As of the time of writing, the price’s percentage rate of trading is estimated at a negative 3.18.
Terra Classic (LUNC) Price Statistics:
LUNC price now – $0.0002920
LUNC market cap – $1.9 billion
LUNC circulating supply – 6.2 trillion
LUNC total supply – 6.9 trillion
Coinmarketcap ranking – #31
LUNC/USD Market
Key Levels:
Resistance levels: $0.00035, $0.00040, $0.00045
Support levels: $0.0002, $0.00015, $0.0001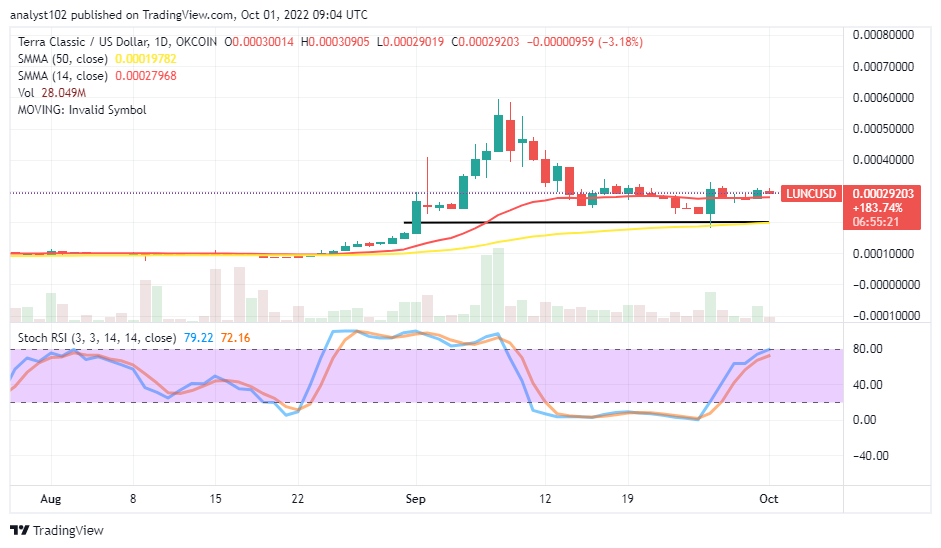 LUNC/USD – Lon-term Chart
The LUNC/USD long-term chart reveals the crypto market builds a buying wall on the emergence of a bullish candlestick barely about a week ago from the $0.00020 support level, breaching through the trend line of the smaller SMA. The 50-day SMA indicator is at $0.0001978, beneath the $0.0002796 value line of the 14-day SMA. The Stochastic Oscillators are closely below the 80 range line, maintaining 72.16 and 79.22 range points. And they look like they are approaching the highest capacity point to push firmly for more ups.
Your capital is at risk
What will likely be the reactions of the LUNC/USD market price soon around the smaller SMA?
It is likely the LUNC/USD market price will go in a correction around the smaller SMA in a low-moving manner even though the crypto builds a buying wall alongside the bullish candlestick formed about some days back. Buyers are to use a 1-hour chart complementing a 4-hour chart to decide when there’ll be capacity exhaustion to the downside at a given point in time before considering launching a buying order.
On the downside of the technical analysis, bears need not allow the LUNC/USD market to push sustainably past the $0.00035 resistance level. Presently, the trading outlook suggests there may be a loss of momentum while there is no volatile motion. There may be a relatively smooth downward-running move against the trend line of the 14-day SMA when buyers attempt to relax efforts around the length of trading capacity created at a high-trading point of the last bullish candlestick that occurred lately.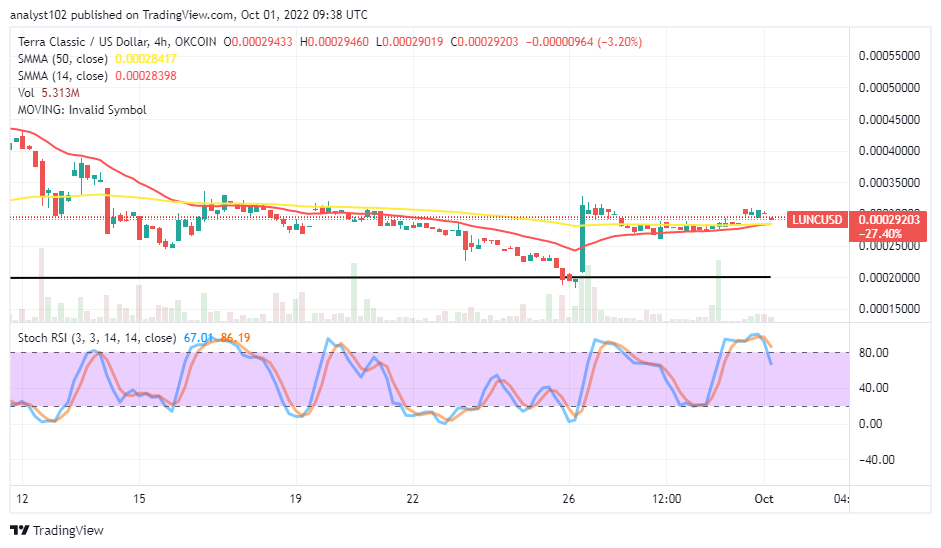
LUNC/USD Medium Chart
The LUNC/USD medium-term chart shows the crypto-market builds a buying wall from a baseline support line drawn around the $0.00020 support level. The 14-day SMA indicator has moved to join the 50-day SMA indicator, which is at $0.0002842, tightly over its positioning at $0.0002840. The Stochastic Oscillators have crossed southbound from the overbought region to the range values of 86.19 and 67.01. That situation portends the possibility of seeing the market running to average the bottom of the bullish candlestick that recently stemmed upward from the horizontal line drawn
Read more:
Join Our Telegram channel to stay up to date on breaking news coverage