
Join Our Telegram channel to stay up to date on breaking news coverage
The Terra Classic (LUNC) price manages to maintain its position, while the bulls maintain the desire to defend the support at $0.00027.
Terra Classic (LUNC) Prediction Statistics Data:
- LUNC price now – $0.00027
- LUNC market cap – $1.7 billion
- LUNC circulating supply – 6.15 billion
- LUNC total supply – 6.9 trillion
- LUNC Coinmarketcap ranking – #31
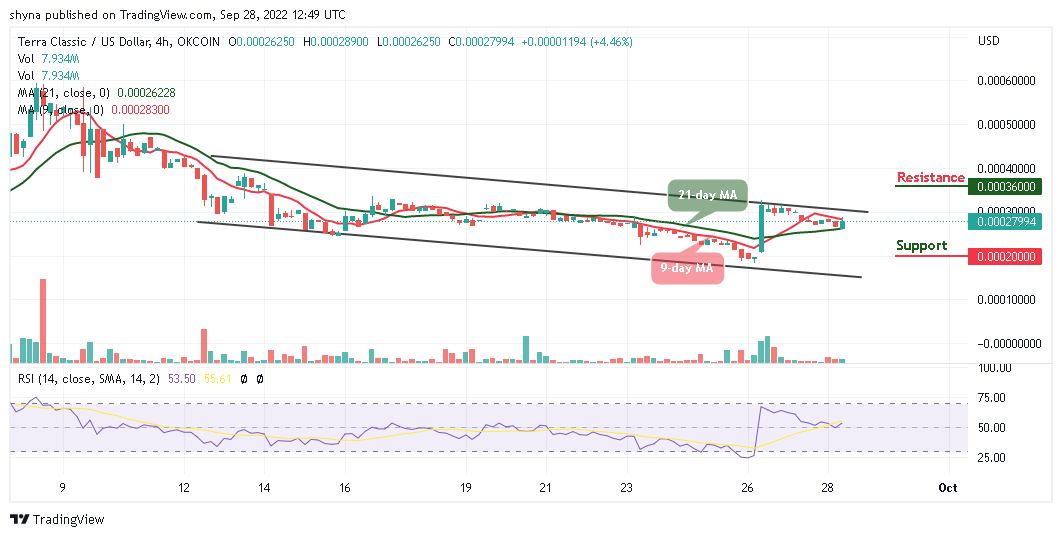
LUNC/USD Long-term Trend: Bearish (4H Chart)
Key Levels:
Resistance levels: $0.00036, $0.00040, $0.00044
Support levels: $0.00020, $0.00016, $0.00012
Your capital is at risk
LUNC/USD is undergoing a much-needed break to the positive side as the coin trades within the 9-day and 21-day moving averages. The Terra Classic is posting gains of over 4.46% at the time of writing, trading above the 21-day moving average at $0.00027.
Terra Classic (LUNC) Prediction: Where is LUNC Price Going Next?
The LUNC price resumes back in the middle of consolidation as the coin crosses above the 9-day and 21-day moving averages. The price is now roaming around the $0.00027 level. Meanwhile, if the market continues the upward movement, the $0.00030 resistance level is likely to surface in the next few positive moves. More so, LUNC/USD pair might further look for higher price levels if the bulls continue to show commitment.
However, the market is currently displaying a sign of subduing volatility with choppy price action. On the other hand, if LUNC/USD crosses below the 21-day moving average and heads toward the lower boundary of the channel, the price may likely roll back to the previous supports at $0.00020, $0.00016, and $0.00012. But as the Relative Strength Index (14) moves above the 50-level, the next resistance levels could be located at $0.00036, $0.00040, and $0.00044 respectively.
LUNC/USD Long-term Trend: Bearish (1H Chart)
On the 1-hour chart, LUNC/USD is ranging, as the coin recently trades above the 9-day and 21-day moving averages, as it continues to rise towards the nearest resistance level of $0.00030. Meanwhile, heading towards the upper boundary of the channel may hit the resistance level at $0.000040 SAT and above.
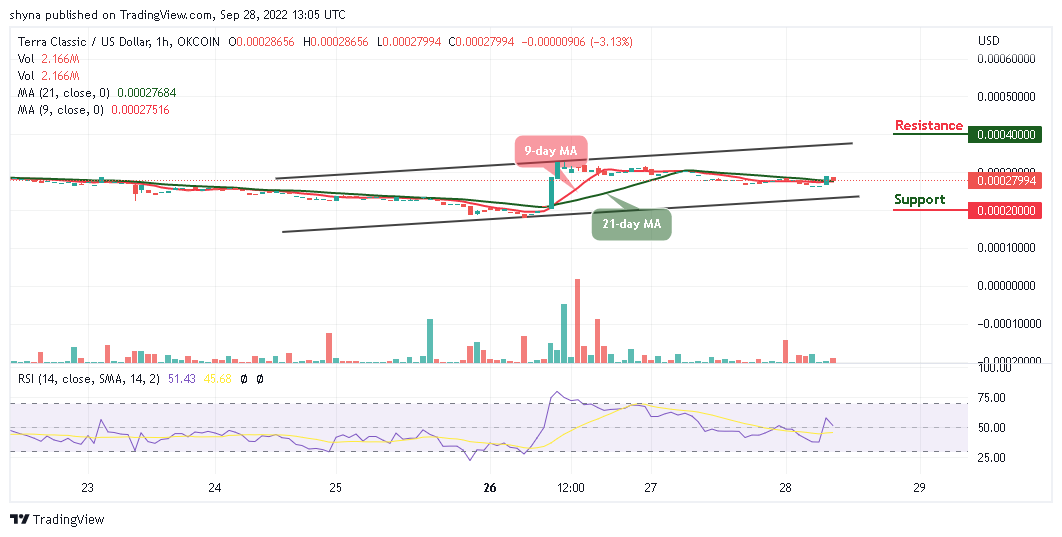
On contrary, any bearish movement by the bears may find the support level at $0.00020 and below. Meanwhile, the technical indicator Relative Strength Index (14) remains above the 50-level.
Join Our Telegram channel to stay up to date on breaking news coverage