Join Our Telegram channel to stay up to date on breaking news coverage
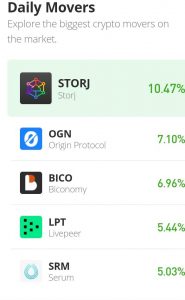
Storj (STORJ) Price Prediction – June 17
The STORJ market strives to push northward from a lower-trading zone against the US currency. The all-time high at $3.91 about a year ago, and the all-time low since Mar 13, 2020 (two years ago) is at $0.04835. The market percentage rate on the return on investment is at a negative of 7.72.
STORJ Price Statistics:
STORJ price now – $0.4844
STORJ market cap – $191.1 million
STORJ circulating supply – 396.7 million
STORJ total supply – 425 million
Coinmarketcap ranking – #119
Storj (STORJ) Market
Key Levels:
Resistance levels: $0.70, $0.90, $1.10
Support levels: $0.30, $0.20, $0.10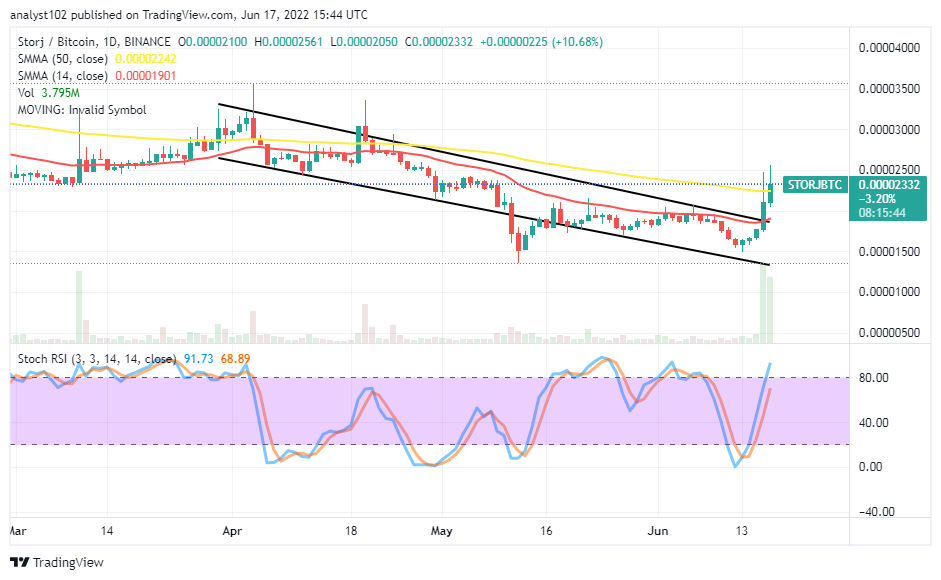 STORJ/USD – Daily Chart
The STORJ/USD daily chart reveals the crypto economy is striving to push northward against the trend line of the smaller SMA. The 50-day SMA indicator is above the 14-day SMA indicator. The upper bearish channel trend line drew southward closely alongside the smaller-trading SMA indicator at the end to markdown the resistant-trading point that price has to face in its northward pushes. The Stochastic Oscillators have touched the zero range point to swing northbound from the oversold region. And they are still relatively pointing toward the north direction at the 40 range.
Will the STORJ/USD market encounter tough resistance soon in its bid of striving to push northward?
The STORJ/USD market may soon encounter resistance around the 14-day SMA trend line between $0.50 and $0.70 if bulls witness a deal pit stops. In the wake of the market trying to hike the northward forces, the price can aim for a touch of the 50-day SMA trend line to complete its slight-mooning motions afterward. It may be late for buyers to launch new entries around the current trading spot.
On the downside of the technical analysis, reading through the trading chart, the forces to the upside direction have featured in a lower-trending mode. About two bearish candlesticks needed to emerge for a confirmation sign to get a selling order that has to execute with a higher degree of levities. The 50-day SMA trading indicator showcases the higher resistance-trading point of the smaller SMA is around $0.80. Bears may regain the strength to push the market southward back even when there is high volatility to the upside afterward.
STORJ/BTC Price Analysis
STORJ market has been striving to push northward against the trending capacity of Bitcoin. Over about four days ago, a line of bullish candlesticks emerged from a lower-trading spot beneath the trend lines of the SMAs as the price has swung high to touch a point over the bigger trading SMA. The 14-day SMA indicator is underneath the 50-day SMA indicator. The Stochastic Oscillators are striving to penetrate the overbought region. If the current bullish doesn’t end with a top-shadow pattern, the base crypto may survive the northward pushes until the following trading day’s sessions against its countering trading crypto. But, new execution of buying orders over the trend lines of the SMAs may suffer a whipsaw in no time.
Read more:
Join Our Telegram channel to stay up to date on breaking news coverage