Join Our Telegram channel to stay up to date on breaking news coverage
The Stellar price prediction may cause the coin to create a new upward movement as the technical indicator heads to the north.
Stellar Price Prediction Data:
- Stellar price now – $0.456
- Stellar market cap – $13.62 billion
- Stellar circulating supply – 30.34 billion
- Stellar total supply – 50 billion
- Stellar Coinmarketcap ranking – #16
Stellar (XLM) exemplifies the benefits of getting into crypto projects early, with a staggering +36,500.93% increase from its all-time low of $0.001227 in November 2014. Over the last 24 hours, XLM has traded between $0.4418 and $0.4842, reflecting steady activity, though it remains -52.13% below its all-time high of $0.9381 from January 2018. This remarkable long-term growth highlights the potential rewards for early adopters and underscores the value of seizing opportunities at the right time in the crypto market.
XLM /USD Market
Key Levels:
Resistance levels: $0.650, $0.655, $0.660
Support levels: $0.250, $0.245, $0.240

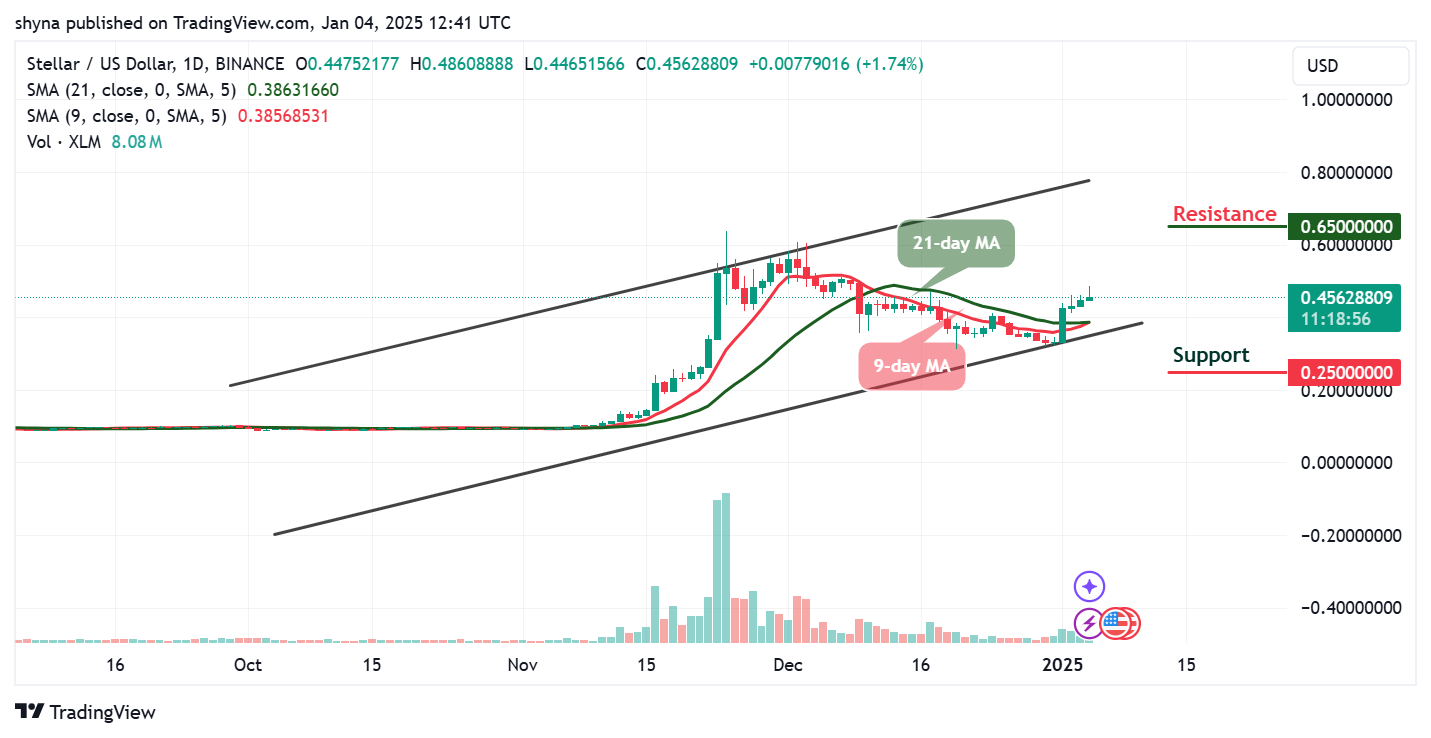
The daily chart of Stellar (XLM/USD) reveals that the price is currently trading above both the 9-day and 21-day Moving Averages (MAs), suggesting a bullish bias in the short to medium-term. The price has also moved upwards within a rising channel, testing the resistance level at $0.486, while the support is firmly established at $0.446. The increasing volume accompanying the recent price action indicates growing interest and momentum in favor of the bulls.
Stellar Price Prediction: XLM Price Could Reach $0.500 Level
According to the daily chart, the Stellar price may continue to create a new uptrend as it is likely for the coin to hit the resistance level of $0.600 if the price moves toward the upper boundary of the channel. Meanwhile, if the bullish momentum continues, the market could retest the upper boundary of the channel near $0.650, which serves as the next significant resistance level. A successful breakout above this level could pave the way for further upside, potentially targeting $0.655 and $0.660 respectively.
On the other hand, a rejection at the resistance level could lead to a consolidation phase or a potential pullback toward the lower boundary of the channel near $0.400, which coincides with the 21-day SMA acting as dynamic support. However, the current price trajectory favors the bulls as long as the market sustains its position above the moving averages and the rising channel’s midline. Traders should watch for a breakout above $0.650 to confirm continued upward momentum or a breakdown below $0.400 for signs of a bearish reversal which could hit the supports at $0.250, $0.245, and $0.240.
XLM/BTC Could Hit 600 SAT Resistance
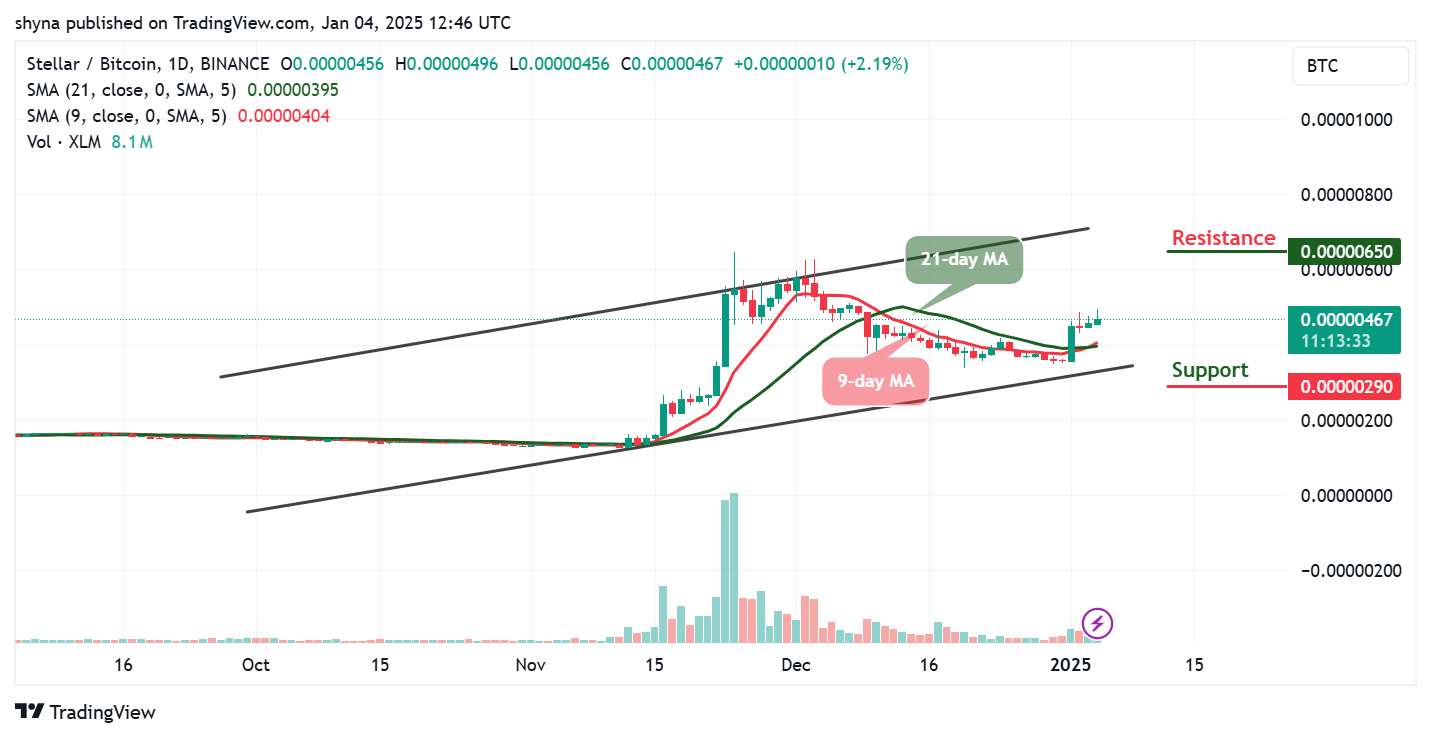
Against Bitcoin, the daily chart for Stellar indicates a bullish trend, with the market price currently at 467 SAT, trading above the 9-day and 21-day Moving Averages (MAs). The price is within a rising channel, and the immediate resistance lies at 600 SAT, while strong support is observed at 290 SAT and below. The recent move above the 9-day MA signals strengthening bullish momentum.

Meanwhile, if the upward trend continues, the market price may aim to test the resistance at 650 SAT and above. A breakout above this level could pave the way toward the next target near 700 SAT. However, a rejection near the resistance could see the price retrace to the 21-day MA or the channel’s midline around 400 SAT, where buyers might step in to provide support.
Nevertheless, @CW8900 shared an analysis with his followers on X (formerly Twitter), highlighting that $XLM is currently testing a major resistance line. If it successfully breaks through, the next target is $0.60, with the ultimate price goal remaining at $0.82.
$SUI pressing its nose against the ceiling… after this it should go into hyperspace. cc @blknoiz06 pic.twitter.com/Qrq004PAZe
— Raoul Pal (@RaoulGMI) January 3, 2025
Alternatives to Stellar
The Stellar price is hovering around the resistance level of $0.456 after touching the daily high of $0.486 during the European session today. This is a move that could easily pave the way for gains toward the upper boundary of the channel to touch the resistance level of $0.600. Therefore, if the 9-day MA crosses above the 21-day MA, the market may show that the bullish grip is getting stronger. Nonetheless, Wall Street Pepe, a meme coin gaining significant attention, is at the forefront of this momentum, raising over $41 million in just a few weeks. With its fast-selling presale, staking rewards, and plans for an exclusive alpha trading group, Wall Street Pepe has analysts and investors optimistic about its potential for massive gains.
Wall Street Pepe – All Signs Are Pointing To Major Gains
Already raising $41 million in record time, $WEPE has captured the attention of analysts and investors alike, thanks to its promising staking rewards and exclusive alpha trading group. The potential for explosive price increases, fueled by a rapidly growing community and strategic momentum, makes this token a game-changer in the crypto space. Don’t wait for the market to peak—seize this chance to invest in Wall Street Pepe now and position yourself at the forefront of what could be one of the most profitable rallies in crypto history.
Related News
- Stellar Price Prediction: XLM Pumps 50%, But Experts Say This Viral Cat-Themed Meme Coin Might Be The Best Crypto To Buy Now
- Wall Street Pepe Fast-Growing Presale Hits $41 Million as Meme Coin Market Surges
Newest Meme Coin ICO - Wall Street Pepe

- Audited By Coinsult
- Early Access Presale Round
- Private Trading Alpha For $WEPE Army
- Staking Pool - High Dynamic APY

Join Our Telegram channel to stay up to date on breaking news coverage


