Join Our Telegram channel to stay up to date on breaking news coverage
The Solana price prediction shows that SOL is recording a downtrend of 7.03% as the coin declines from $77.19 to touching a low of $69.21.
SOL/USD Market
Key Levels:
Resistance levels: $95, $100, $105
Support levels: $50, $45, $40
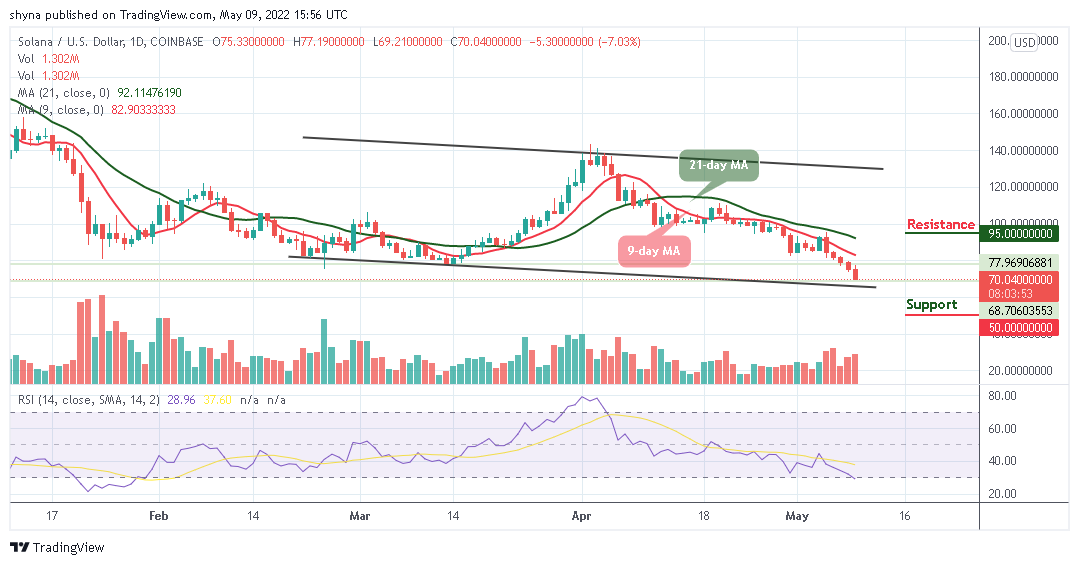
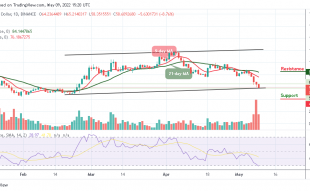
After touching the daily high of $77.19 today, SOL/USD is seen crossing below the 9-day and 21-day moving averages and heading towards the support level of $70. The Solana price is facing the lower boundary of the channel while the technical indicator Relative Strength Index (14) indicates an increase in bearish momentum as the signal line could move to cross into the oversold region, which indicates that the market sentiment is presently bearish.
Solana Price Prediction: SOL Price Ready for More Downs
At the time of writing, the Solana price is heading to the downside where it is moving to cross below the channel. However, if SOL/USD rises again and trades above the 9-day and 21-day moving averages, the coin may begin its upward movement which could retest the previous high.
In the meantime, the nearest resistance levels may be found at $95, $100, and $105 but any further bearish movement below the lower boundary of the channel may locate the support levels at $50, $45, and $40.
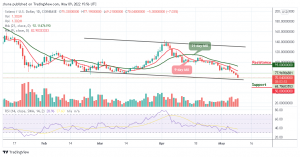
SOL/BTC Market: Solana Price May Gain More Lows
When compared with Bitcoin, the Solana price is currently trading below the 9-day and 21-day moving averages as the coin gets ready to cross below the lower boundary of the channel. However, if the sell-off later becomes huge, the next level of support may surface and could locate the support level of 1800 SAT and below.
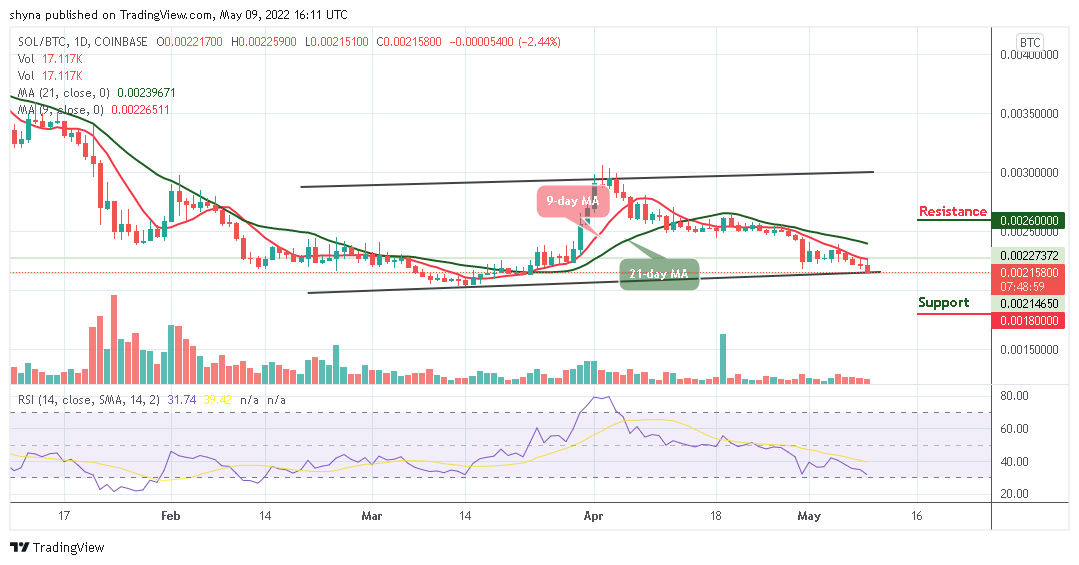
On the upside, if the bulls gather and push the market price above the 9-day and 21-day moving averages; Solana could face the resistance level of 2500 SAT. Any further bullish movement above this level may hit the potential resistance at 2600 SAT and above. On the contrary, the technical indicator Relative Strength Index (14) is moving to cross into the oversold region and once this comes to play out, SOL/BTC may bring more bearish pressure into the market.
Join Our Telegram channel to stay up to date on breaking news coverage